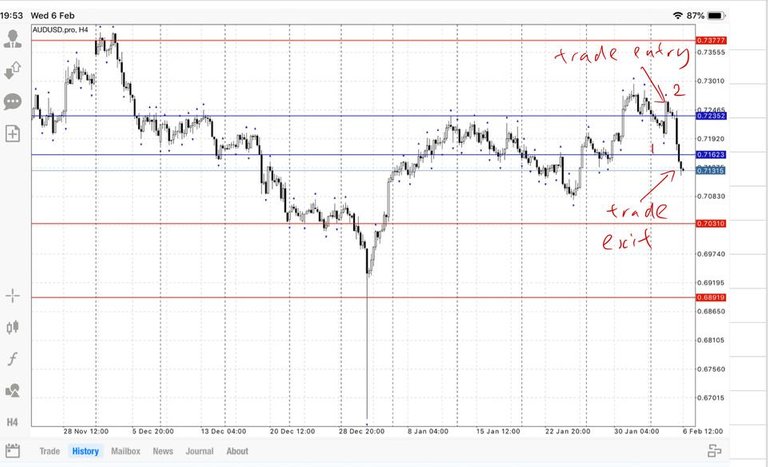
Note the approximate entry and exit points indicated on the chart.
This is the chart of the AUDUSD on 6 Feb 2019. There was a break of the support level at 0.7235 and both a H4 and D1 close below this level on 4 Feb 2019. The trade was placed soon after this break with a sell limit at 0.7235, SL = 0.7255 and TP = 0.7135.
Initially, my concern was that the price would not retrace enough for the order to go through. The break through the level was quite strong with a larger candle than the previous one. However, the order did go through after a price spike upwards. This was due to the RBA (Royal Bank of Australia, Australia's central bank) statement on 5 Feb 2019. Now the trade was negative, which lead to me second guessing my entry.
I finally decided to trust my analysis. I left the trade alone. (Don't look at it every hour!) After the price spike, it resumed its downward trend. Soon after that, on 6 Feb 2019, the price accelerated downwards and reached the profit target.
I chose to set a 100 pip target even though there's a possibility that the price could continue to move lower. Based on the wave counts, this movement should be part of wave 3, usually the largest part of the 5 wave count. However, I've learnt to take my profits when I can and a 100 pip move is nothing to sneeze at. There may be an opportunity to enter this trade again in the near future once wave 3 is complete. I just need to wait for the right opportunity.

Congratulations @huangriver! You have completed the following achievement on the Steem blockchain and have been rewarded with new badge(s) :
Click here to view your Board
If you no longer want to receive notifications, reply to this comment with the word
STOPDo not miss the last post from @steemitboard:
Congratulations @huangriver! You received a personal award!
Thank you for taking part in the early access of Drugwars.
You can view your badges on your Steem Board and compare to others on the Steem Ranking
Do not miss the last post from @steemitboard: