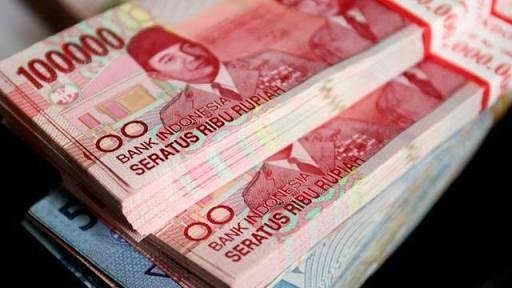
The Indonesian currency of the rupiah is weakening last week and penetrated the strong resistance of 13655 versus USD, before closing at 13663. After the release of the minutes of the FOMC meeting, the Rupiah was at 13689, the lowest level since November 2016. But then, the price turned up as correction the USD index after the FOMC minutes. From within the country there is no release of important data or positive sentiment that could boost the Rupiah exchange rate.
Not only the Rupiah, almost all Asian currencies including the Japanese Yen weakened versus the Greenback. The FOMC minutes from January to February are hawkish. All voting voting members agree on a 3-times rate hike plan this year, and optimistic that inflation could hit targets as economic growth grows.
This week there will be Indonesia's inflation data release in February, which is expected to stabilize in the range of 3.25% to 3.50% y / y. But the market will focus more on the testimony of the new Fed chairman, Jerome Powell, who has officially served this February. The event will be held on Tuesday and Thursday of this week. Testimonials in front of House and Senate that were not so important this time are considered important, because it will reflect the views and steps of Powell in leading the Fed up to 4 years into the future.
Technically, in the medium to long term, the Rupiah will still tend to weaken. If it continues to weaken, USD / IDR strong resistance is at the level of 13723 up to 13800. While if strengthen, strong support at 13606 until 13568.
Fundamental Data Release Schedule
Monday, February 26, 2018
14:00 WIB: credit growth data for January 2018 year over year (y / y). Previous month: + 8.35%.
Rupiah Analysis February 26 - March 2
Wednesday, February 28, 2018
16:15 WIB: M2 money supply in Indonesia in January 2018 y / y. Previous month: + 8.3%.
Rupiah Analysis February 26 - March 2
Thursday, March 1, 2018
At 7:30 am: Indonesia's PMI Manufacturing Index of the Nikkei in February 2018. The previous month: 49.9, forecast: 49.87.
Rupiah Analysis February 26 - March 2
11:00 WIB: Indonesia's total CPI in February 2018 y / y. Previous month: + 3.25%. Estimates: + 3.50%.
Indonesia's total CPI in February 2018 m / m. Previous month: + 0.62%. Estimated: + 0.44%.
Indonesia's core CPI in February 2018 y / y. Previous month: + 2.69%. Estimated: + 2.63%.
Rupiah Analysis February 26 - March 2
11:30 WIB: The number of foreign tourist arrivals to Indonesia in January 2018 y / y. Previous month: -5.77%.
Rupiah Analysis February 26 - March 2
Tuesday, March 6, 2018:
16:00 WIB: Indonesian consumer confidence index in February 2018 m / m: previous month: 126.1. Estimates: 124.9.
Rupiah Analysis February 26 - March 2
Data and events affecting the US this week are Fed Fed Chairman Jerome Powell, GDP, ISM Manufacturing, consumer confidence index, Durable Goods Orders, New Home Sales, Core PCE Price Index, Jobless Claims and Fed Quarles speech.
Technical Review
Rupiah Analysis February 26 - March 2
click image to enlarge
Daily Chart: In the short term, there is a possibility of a bearish correction (Rupiah tends to strengthen) as there is a bearish Divergence RSI indicator. Reinforcement USD / IDR last week stuck at Fibo Expansion 76.4%, but in the medium to long term still tends to be bullish (Rupiah still tends to weaken):
The price is still above the mid-band Bollinger Bands indicator curve, and the Parabolic SAR indicator point is still below the candlestick bar.
The MACD indicator curve fails to penetrate the signal curve (red) and still moves above it, while the OSMA histogram line is still above the 0.00 level.
The green ADX indicator histogram line is above the 25 level, indicating a strong bullish sentiment.
Weekly Pivot Level: 13626.00.
Resistance: 13689.00 (level 76.4% Fibo Expansion); 13723.00; 13819.82 (100% Fibo Expansion); 13905.00; 13954.00 (123.6% Fibo Expansion); 14012.00; 14063.00; 14133.00; 14337.00; 14493.00; 14784.00.
Support: 13655.00; 13606.60 (61.8% Fibo Expansion); 13568.00; 13541.45 (50.0% Fibo Expansion); 13520.00; 13474.85 (38.2% Fibo Expansion); 13453.00; 13393.77 (23.6% Fibo Expansion); 13362.00; 13314.00; 13263.00; 13212.64; 13171.00; 13082.00; 13048.00; 12990.00; 12899.00; 12800.00; 12754.00; 12623.00; 12560.00.
Indicators: Simple Moving Average (SMA) 200 and EMA 50; Bollinger Bands (20,2); Parabolic SAR (0.02, 0.2); MACD (12,26,9); OSMA; RSI (14); ADX (14).
Fibonacci Expansion:
Point 1: 13082.00 (lowest price September 11, 2017).
Point 2: 13640.00 (price as high as 27 October 2017).
Point 3: 13263.00 (lowest price January 25, 2018).
I hope we can stand below of IDR.10.000/dollar.
A valuable information
13800