GET READY to increase your Bitcoin balance on Ruby Coin as it BOOMS another +55% in the next two weeks!
.jpg)
The Anderson Report
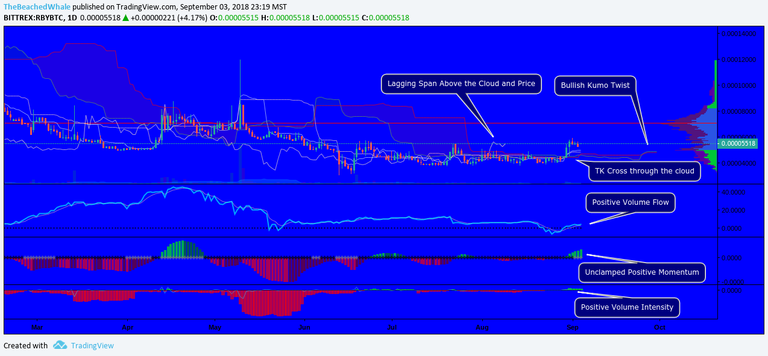
The charts have spoken, and the next two weeks are certain be a boon for Ruby Coin holders. The altcoin market continues the claw back gains against Bitcoin, and RBY won't be left out. Currently the RBY chart is one of the most bullish compared to most other altcoins, check it out below.

Price Action:
When looking closely at the chart above, its clear that RBY is has moved above the Ichimoku cloud on the long-term 1D charts, a very bullish signal when combined with a lagging span above the previous price and cloud and a Kumo twist. When price action made its move above the cloud, the Tenkan-Sen line crossed the Kijun-Sen line in one of the most bullish ways possible: right through the cloud before the two lines split on the upside.
Other Indicators:
When considering trades, price action isn't the only indicator to look at. Looking at the chart above, directly below the price history, the first of the three indicatators shows the volume flow is has increased buying stength which is outpacing selling strength by crossing over the neutral horizontal line; this cross is the first of several key components used to judge whether a trade is worth taking.
The second to the bottom indicator shows momentum. Currently the momentum of the price movement is bullish and unclamped, meaning it has a lower chance to remain in the current price range with a bias towards upward movement. Let the odds work for you here.
The bottom indicator shows volume intensity. While it remains low, it is not negative. It is clear that accumulation by buyers has begun pressuring an incoming rise. This upward trend in volume intensity is expected to increase given the other bullish factors mentioned previously.
Profit Maximization Strategies

Entry:
Long term investors who've been holding should simply continue to do so. Traders looking to scalp a quick 50% off this market should look for entry on the current dip and avoid market buys. Placing buys at retrace points (typically at the Kijun-San support line) below the current price where others would place stop-sells often times will give serious contrarian gains.
Exit:
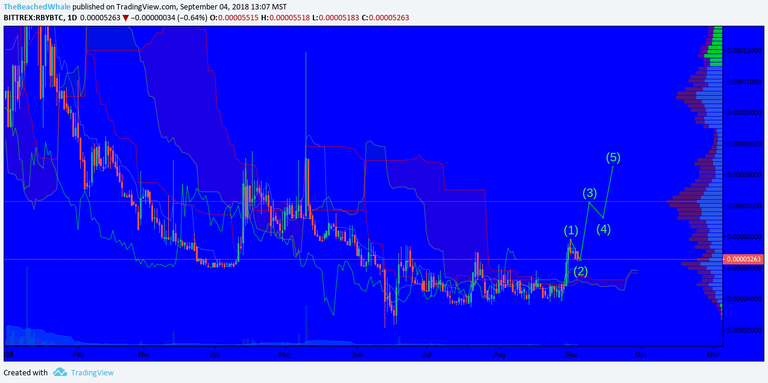
Major resistance exists at 7100 sats as this is the current volume point of control (POC) for this stretch of the 1D chart. After a pullback from the POC, a bounce to the next point of major previously traded volume at 8400. Sells should be set right below the 8500 sat level in order to ensure an exit if the price begins to meet resistance on the rise. This move is projected to be completed by September 19th giving an daily average expected gain (DEGA) of 3.75%. A full entry and exit within this timeframe will approximately give +55% of BTC placed in this position. Referencing past pumps, RBY moves quick and hard often times wicking back; a slow move up would be bullish for a longer term hold.
As always friends, do your own research, balance your portfolio, practice tight risk management; and all time frames are an estimation, +/- a few days and percent is realistic.
Have you bought or sold any RBY recently?
Is there any topics you'd like to see covered?
Leave your answers in the comments below.
This is Steemit Exclusive - All content is, owned, written and edited by me. This article is not investment advice.


RBY Up Nearly 10% Today Already
12 Hours Later:
-The ฿itcoin Profiteer
very good that you post things like this very good analysis
Congratulations @thebeachedwhale! You received a personal award!
You can view your badges on your Steem Board and compare to others on the Steem Ranking
Vote for @Steemitboard as a witness to get one more award and increased upvotes!