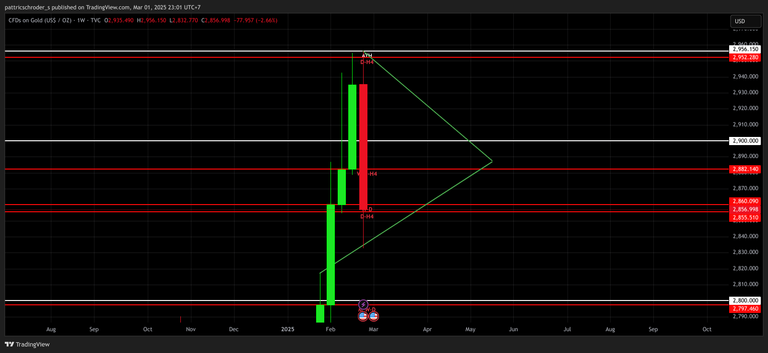
We'll be checking the weekly timeframe first as the market is already closed, so now the week candle would either be a support or resistance. We do see that on the the week candle lift up to create a wick and a new All Time High before pulling back and came crashing down crossing 3 support levels at 2,900.000, 2882.140 and 2,860.090 and was able to successfully break those 3 supports by closing below them. So now the chart is bias to the downtrend from it's latest price action, though we can't be selling just like that since there is nothing to confirm the direction of the trend yet and at least to sell, we should be selling when the price retrace to the upside clearing sell volumes on the market before we can start selling.
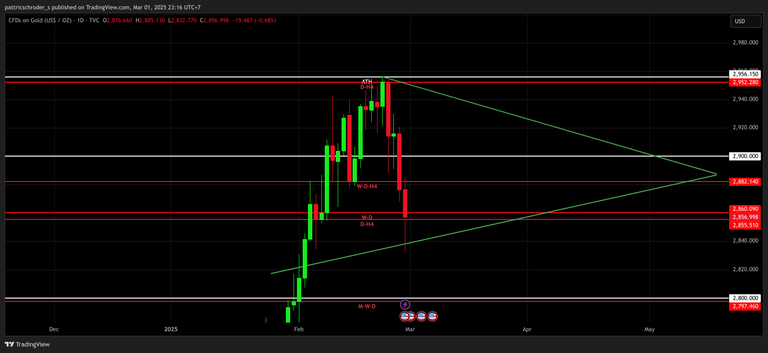
The daily timeframe isn't much different from the weekly timeframe as it did the same thing by crashing down, and was able to successfully break the support by closing below them. The true trend though, is still on the buy side even though it came crashing down non stop if you seriously look at the HTF. All it could be doing is just to clear buy volumes on the market and not just clearing buy position that's on negative floating profit. They're also pressuring those who have heavy buy position all the way from the bottom
and are still holding on to that position to close those positions. Then after that Gold may start reversing back up. Leaving those who follow sell at the bottom of the wick.
The best way to actually win in this market is to be the last one to lose, because once the market clear off most of the volume it was expecting to clear, it'll then start going back to it's original trend.
P.S. The market isn't design for anyone to win, just know that by being the last one to lost means you 'll still have a chance to win from this market.