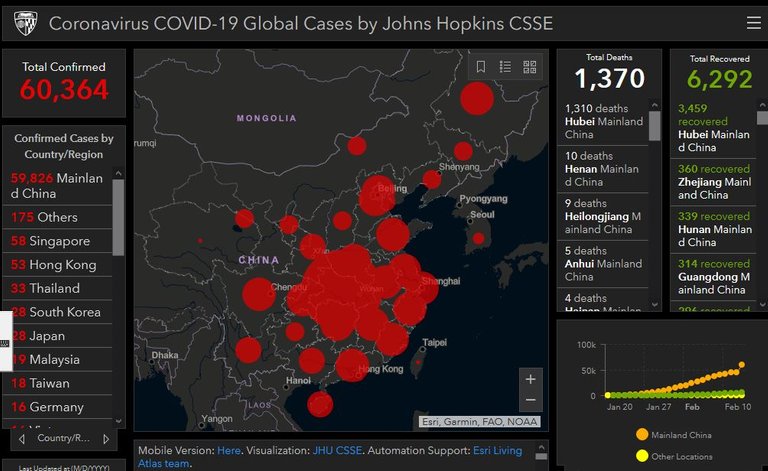
Wednesday February 5th 2020 10:16 PM EST

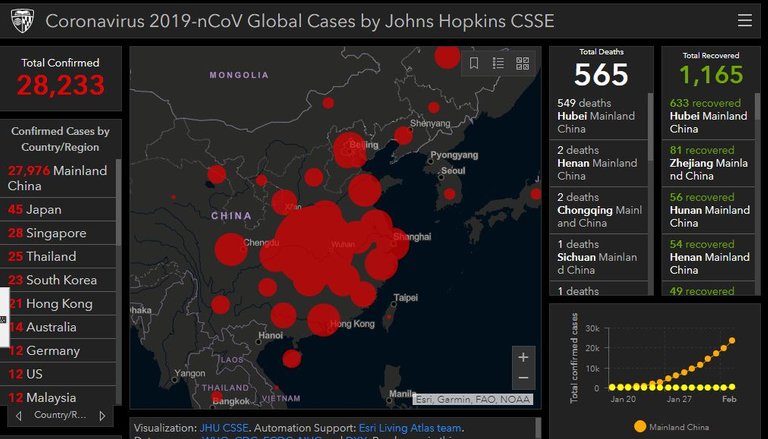
Monday February 3 2020 PM

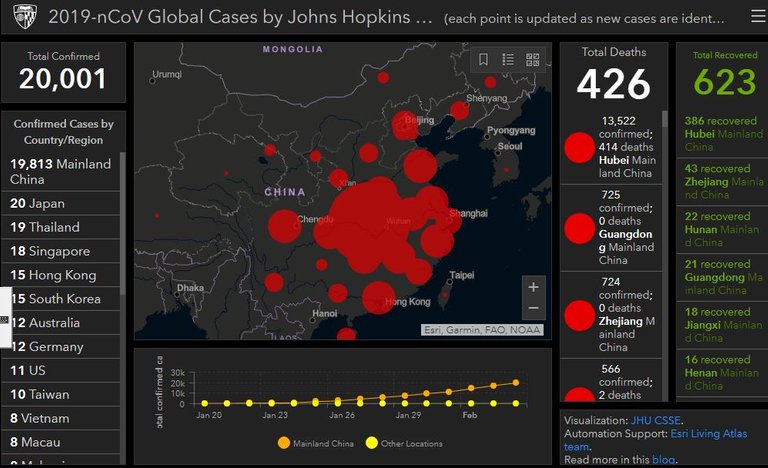
Sunday February 2 7 PM Eastern Standard time...

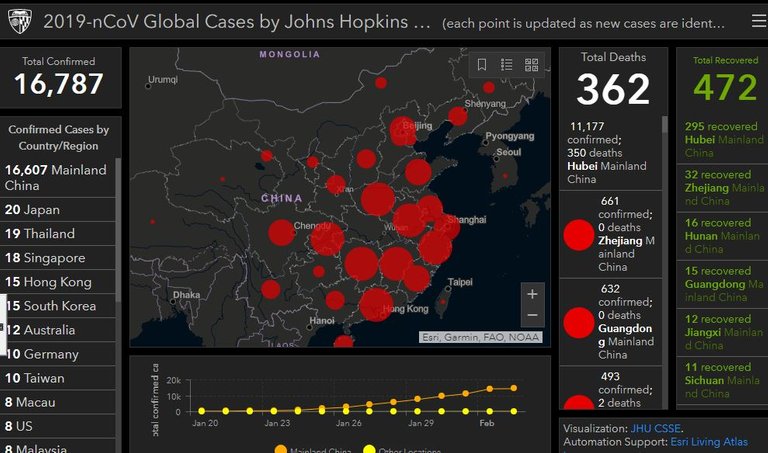
At 10:05 EST February 1 2020

At 8:30 PM EST February 1 2020
At 7:30 EST February 1 2020
Jan 31 Midnight 2020 ET


At 7:30 EST February 1 2020
Jan 31 Midnight 2020 ET