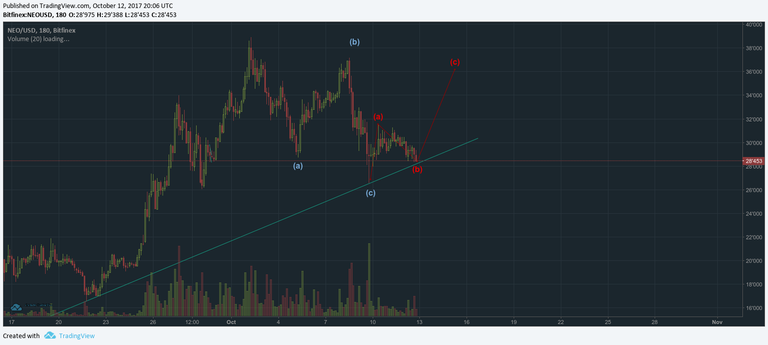
I was remembering this now old post, and I see NEO has hit the support trend line. So as an exercise I draw the last (a)(b)(c) so that (b) fits the new data. This would mean either a rebound on the support trend line o continuing down to the next support around 16, right?

IF the support holds, then the white labels are mine and expect an impulse of five waves up.

Thanks for taking the time to answer! Doing is the best way to learn.
IF the support holds, the white labels are mine:
