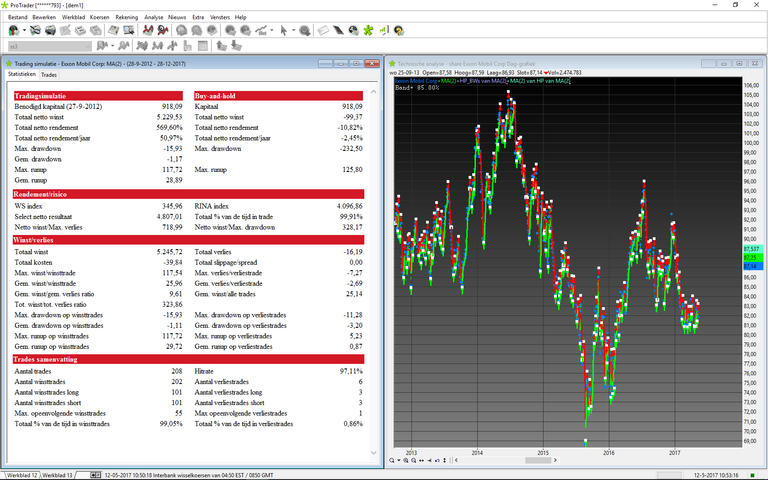
Backtesting results from 2013-2017 in Exxon using the Hodrick Prescott indicator (12-05-17)
First indicator is a 2 day moving average on the close price of Exxon.
attached to that is the Hodrick Prescott indicator with a lamba of 1
attached to that is a 2 day moving average to do the backtesting with:)
Starting amount in example = 1000 dollar
End result = 5200 dollar

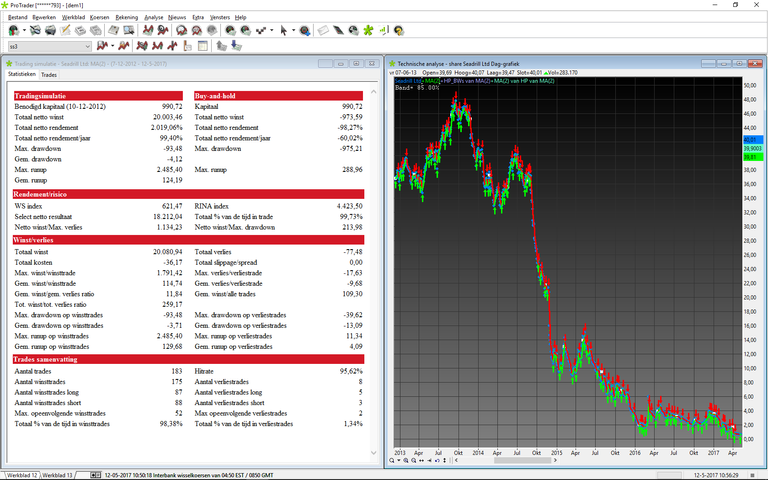
Backtesting results from 2013-2017 in Seadrill using the Hodrick Prescott indicator (12-05-17)
First indicator is a 2 day moving average on the close price of Seadrill.
attached to that is the Hodrick Prescott indicator with a lamba of 1
attached to that is a 2 day moving average to do the backtesting with:)
Starting amount in example = 1000 dollar
End result = 20000 dollar

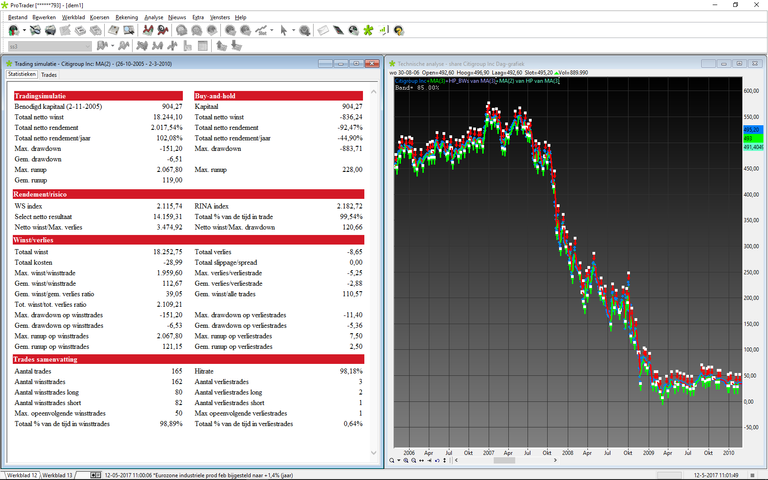
Backtesting results from 2006-2010 in Citigroup using the Hodrick Prescott indicator (12-05-17)
First indicator is a 3 day moving average on the close price of Citigroup.
attached to that is the Hodrick Prescott indicator with a lamba of 1
attached to that is a 2 day moving average to do the backtesting with:)
Starting amount in example = 1000 dollar
End result = 18000 dollar

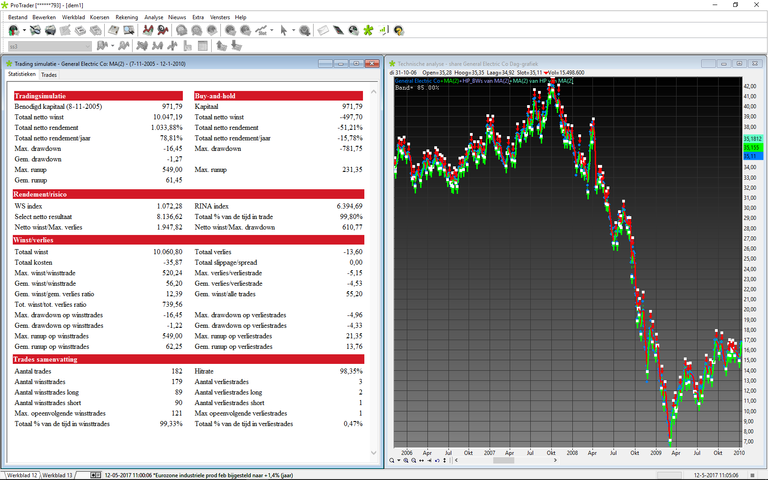
Backtesting results from 2006-2010 in General Electric using the Hodrick Prescott indicator (12-05-17)
First indicator is a 2 day moving average on the close price of General Electric.
attached to that is the Hodrick Prescott indicator with a lamba of 1
attached to that is a 2 day moving average to do the backtesting with:)
Starting amount in example = 1000 dollar
End result = 10000 dollar

Perfectly!