 These interactive map and charts show the drug-related fatalities reported since May 10, 2016 based on ABS-CBN's independent monitoring of national and local news reports, and PNP Regional Office and PDEA press releases.
ABS-CBN categorized these fatalities tagged in drugs by the way they were killed:
a) Killed in operations conducted by law-enforcement agencies: the alleged drug suspects were killed by police and other law enforcement officers during the conduct of anti-illegal drug operations, including entrapment operations, raids, and follow-up operations. This category also includes those killed in in flagrante delicto cases (in the very act of committing a crime) and apprehensions that reportedly escalated to a shootout.
b) Killed by unidentified assailants: the individuals tagged in drugs were killed by unidentified assailants in shooting incidents or by motorcycle-riding gunmen. The incident was either witnessed by other people or captured on CCTV.
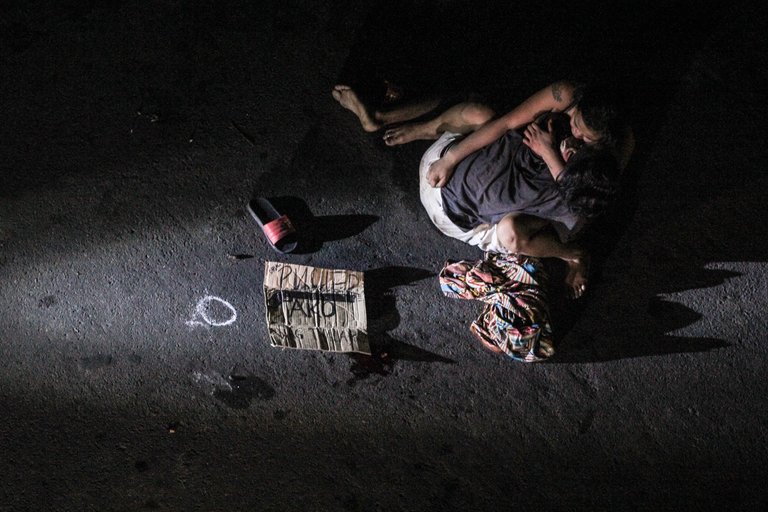
c) Bodies found away from the crime scene: the victims' bodies were discovered with a label tagging them in drug-related activities (usually a cardboard bearing the words "drug pusher", "drug user" or "drug addict") or there are illegal drugs reportedly recovered from the body. The victims' faces and bodies usually bear gunshot wounds, and sometimes even stab wounds. The victims' arms or legs, or both, are also usually bound and the bodies wrapped in tape.
The proportion of each category relative to the total death toll is illustrated in the pie chart. The heat map illustrates the magnitude of drug-related deaths per province/city: the redder the color of a province/city in the map, the higher the number of drug-related deaths reported in that area.
The table meanwhile, shows the names and aliases of those who were killed, as well as the dates and areas where the killings took place. Each column in the table is sortable.
The data on the map, charts, and table are interconnected. For example, clicking on a province/city on the map will show the corresponding details for that area in the charts and tables, such as the death toll in that province/city; the names of those killed and the dates when the incidents took place; and the type of incident. Clicking on the chart and tables will likewise reveal the corresponding information on the map.
Hi! I am a robot. I just upvoted you! I found similar content that readers might be interested in:
http://news.abs-cbn.com/specials/map-charts-the-death-toll-of-the-war-on-drugs
thanks a lot..