Today, I realized that while Pi has been turned into musical notes before, I’d never seen it represented as visual art.
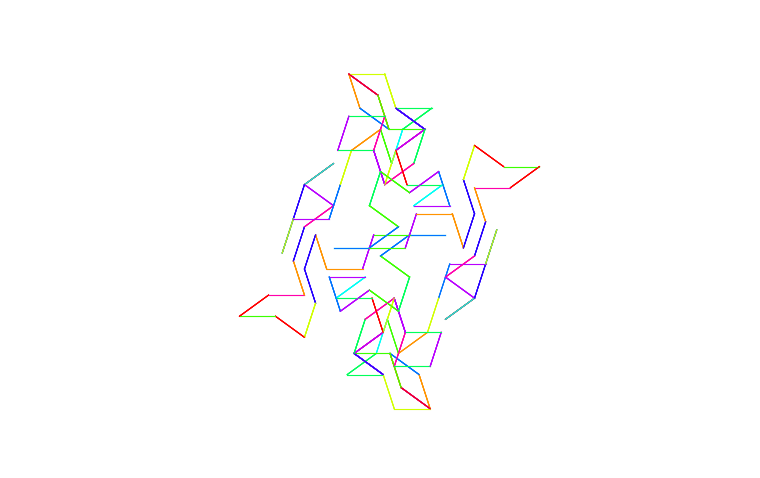
First try: first 64 digits, 500 steps
So I decided to whip up a Python script that will do just that. When I was brainstorming this, I added Golden Ratio to the bunch, because hey, that's an endlessly repeating number too, or at least its digits are, just like with Pi!
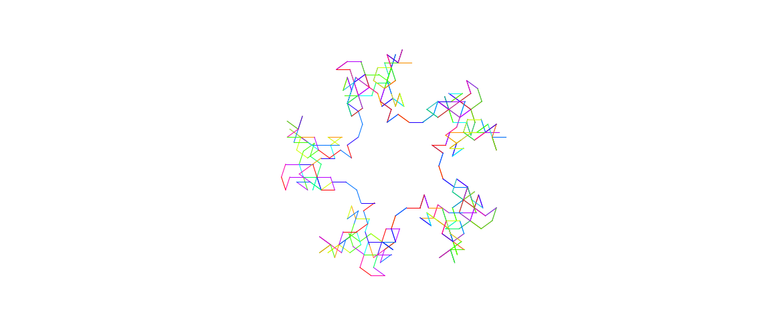
In a nutshell, my script calculates both Pi and Golden Ratio, up to as many digits I set in num_digits with a freely adjustable start_position, then it iterates through those digits, calculates an angle, and draws a line after each angle. num_segments decides how many steps, or lines the script will draw.
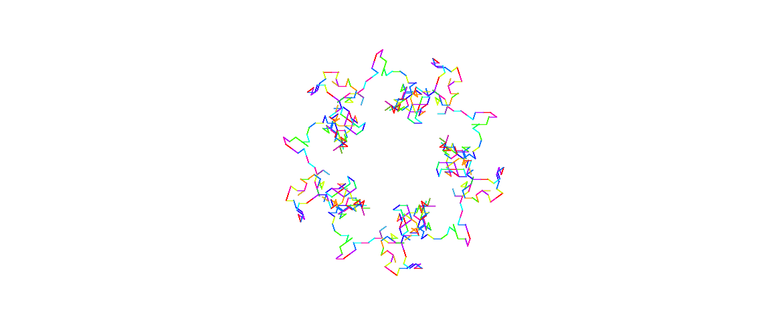
To make things more interesting, I set the Golden Ratio as the colours of the lines. So in between each step, a colour hue will be chosen based on the current digit of the Golden Ratio, similarly to the angle with the Pi.

I then made a copy of the original script, with direction_digit and color_digit swapped, so I could also create images based on Golden Ratio, with colours set by Pi.
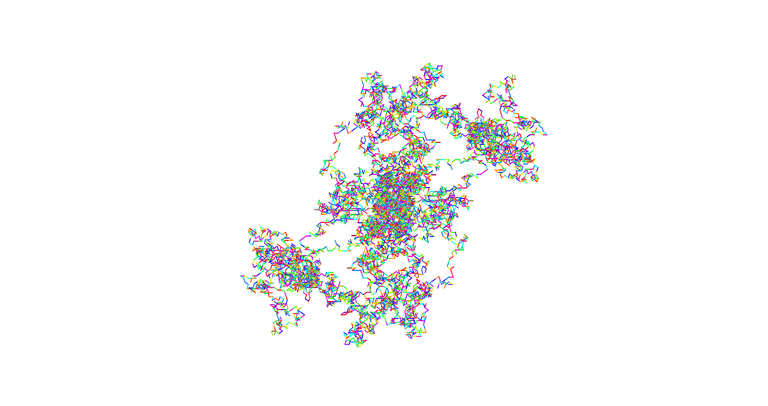
Golden Ratio visualization
I was quite surprised of how the pictures turned out. I didn't expect them to be so fractal-like (although not exactly fractals) and organic. I really like the results!
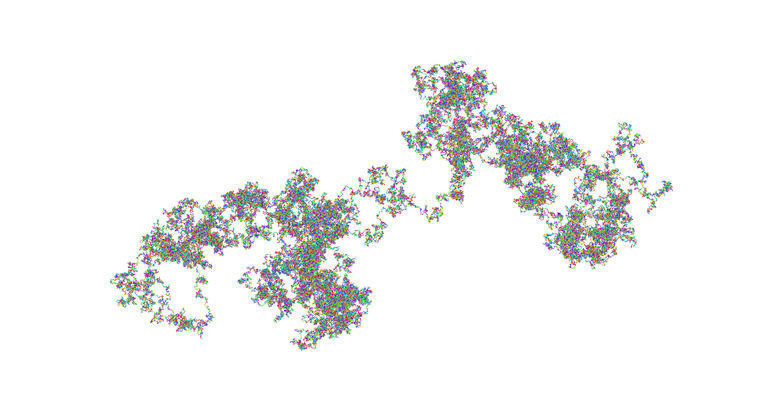
Golden Ratio — Pi colours — 150000 segments

Pi — colours decided by Golden Ratio — 150000 segments
I need to change the colour algorithm to something else, hopefully making it a bit more pleasing to the eye. Anyway. I hope you liked these, and I'll leave you with the code, here:
# pi.py

import numpy as np
from matplotlib import pyplot as plt
from mpmath import mp

# Parameters for calculating constants
num_digits = 128  # Number of digits to use
start_position = 25  # Starting position to the sequence

# Set the precision in mpmath for arbitrary-length calculations
mp.dps = (
    num_digits + start_position + 1
)  # Set precision slightly higher to ensure enough digits

# Convert Pi and Golden Ratio to strings and remove the decimal point
# I thohought this might be a better form than the previous where I removed "3." and "1.".
# This'll mean the rotation of the pictures produced by this new script slightly differ from originals.
pi_digits = str(mp.pi).replace('.', '')[start_position:start_position + num_digits]
golden_ratio_digits = str(mp.phi).replace('.', '')[start_position:start_position + num_digits]

# Drawing Parameters
num_segments = 1500  # Total number of line segments to draw
segment_length = 0.05  # Length of each line segment
angle_step = 36  # Degree step per Pi digit for direction (0-360°)
hue_step = 36  # Degree step per Golden Ratio digit for color in HSV

# Starting point and angle_step
x, y = 0.5, 0.5  # Start in the middle of a 1x1 canvas
current_angle = 0.

# Set up the plot
fig, ax = plt.subplots()
ax.set_aspect("equal")
ax.axis("off")  # Turn off the axis for a cleaner look

# Define the color map explicitly
color_map = plt.get_cmap("hsv")

# Drawing loop
for i in range(num_segments):
    # Get current direction and color digits
    direction_digit = int(pi_digits[i % len(pi_digits)])
    color_digit = int(golden_ratio_digits[i % len(golden_ratio_digits)])

    # Calculate the new angle for direction
    current_angle += direction_digit * angle_step

    # Calculate the hue for color, wrapping around 360 degrees
    hue = (color_digit * hue_step) % 360  # Changed to 360 for a full color range

    # Convert hue to RGB color for plotting
    color = color_map(hue / 360.0)  # Normalized hue for HSV colormap

    # Calculate endpoint of the line segment
    dx = segment_length * np.cos(np.radians(current_angle))
    dy = segment_length * np.sin(np.radians(current_angle))
    new_x, new_y = x + dx, y + dy  # Define new_x and new_y

    # Plot the line segment
    ax.plot(
        [x, new_x], [y, new_y], color=color, linewidth=0.75
    )  # Corrected "color" to "color"

    # Update the current position
    x, y = new_x, new_y

# Show the final plot
plt.show()
One minor gripe... Speaking of “Colours”, I hate it that I must use color instead of colour everywhere in my code, because the libraries use American spelling. Yes, I could use aliases and variable names, but for some reason it just confuses me to have both color and colour in the code, so I eventually ended doing :%s/colour/color/g, and now the code is in all-American style. But I still hate it.
Heh. It was fun. Did you like this? Comments below!
