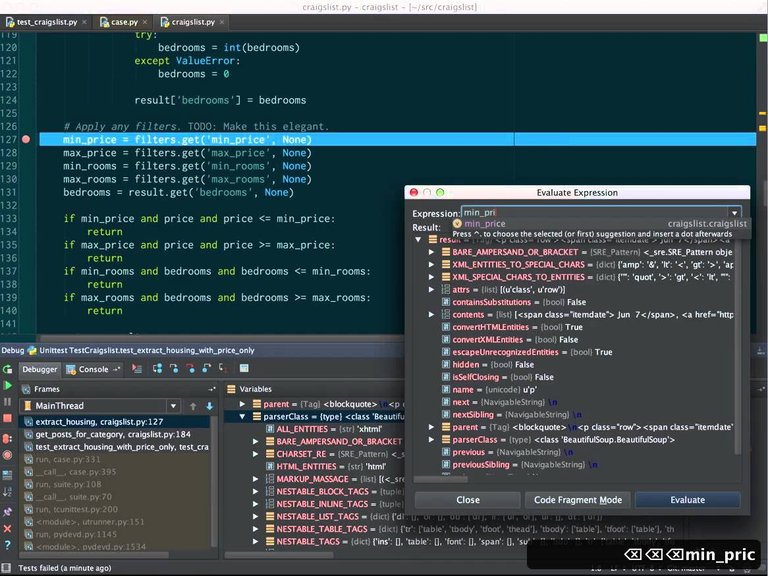
Personally I do not like to debug with printf's or gdb-like tools. The reason for that is you cannot easily skim data which are on stacktrace, you cannot so easily change those variables in runtime, and so many other things...

I find out, that people which debugs with prints in most cases use vim as a editor. Don't let me wrong, I also like vim, but it is only very powerful editor. IDE gives you in most cases much more... but you have to give up more RAM ;)
When you are developing on remote servers, you don't always have the luxury of the nice GUI of various IDEs. X forwarding over ssh sucks ...
For all my real debugging tools (whenever I am testing code on full-scale production on hundreds of cores and ten thousands of threads), I use PAPI hardware counters, but more importantly Score-P, which gives me a lot more detailed aggregate information on time spent in MPI communication, stack trace on a given thread, etc.
I should also add that I have to debug other people's code, so, in this case, gdb and addr2line are very useful, especially when I am not familiar with the codebase.
Debugging my own code is a nightmare. Debugging other's is hell.