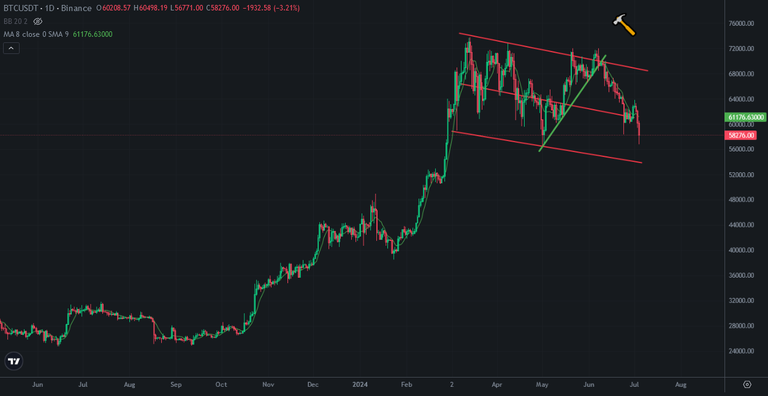
Bitcoin price is going down. I am not surprised. I shared lots of analysis about Bitcoin price chart. I said There were lots of bullish traps when Bitcoin price was at 72K. Lots of investors trapped. They bought full of altcoins while they were waiting Bitcoin price for more than 100K in this year. I was ready for price dump when they were picking up all altcoins from the top!
Here you can see my draft on Bitcoin price chart. I shared it a few months ago. Bitcoin price is moving as my draft. The next target is to touch the bottom line of descending channel. I am waiting to see Bitcoin price at 52K. Bitcoin price has a break at the middle line of descending channel and started againg to go down.
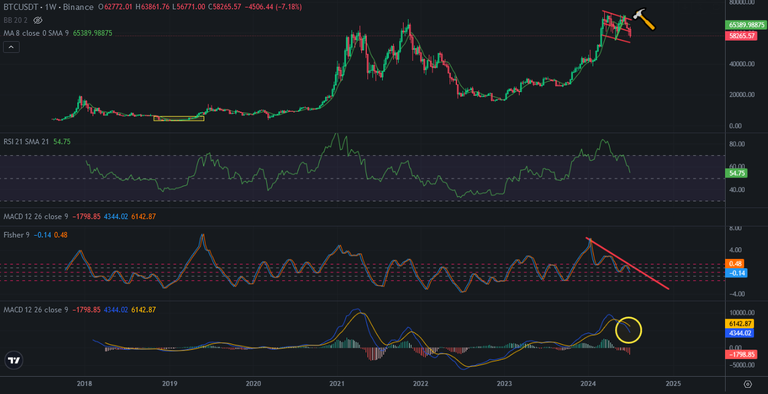
Here you can see weekly chart of Bitcoin price. We are only at the beginning of price dump! Bitcoin price is going down and MACD Indicator is also going down as falling down on waterfall.
There is downtrend line on Fisher Indicator. Bitcoin price will be under downtrend pressure until breaking up the downtrend line. We may see relief on Bitcoin price chart at September.
Market makers motto happened again. Sell in May and Go Away.
I am waiting with my cash to buy more altcoins. I will start to buy in August and September.
We will see..
Posted Using InLeo Alpha

