
Welcome to the daily analytical report about Steemit.
All the information presented in this report are based on the data collected from the blockchain until 2017-12-22 midnight UTC time. The goal of this report is to provide you with a clear view on what is happening daily on Steemit.
1. New users
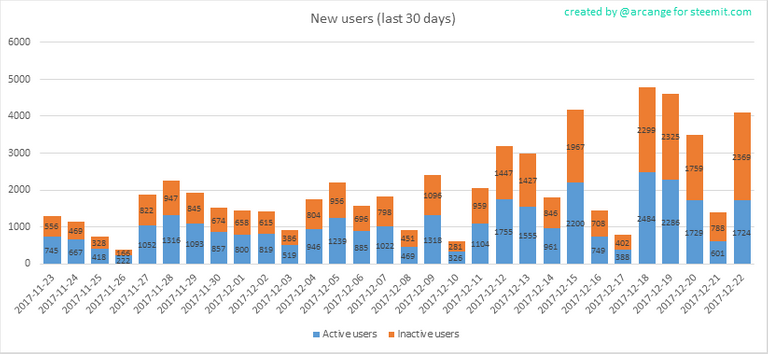
This chart shows the number of newly registered users on Steemit and how many of them became active. We see that a lot of accounts are registered, but never used.
Warning: this graphic is kind of dynamic! A user can register one day and become active a few days later. Therefore, the number of active users on a specific date may change from day to day.
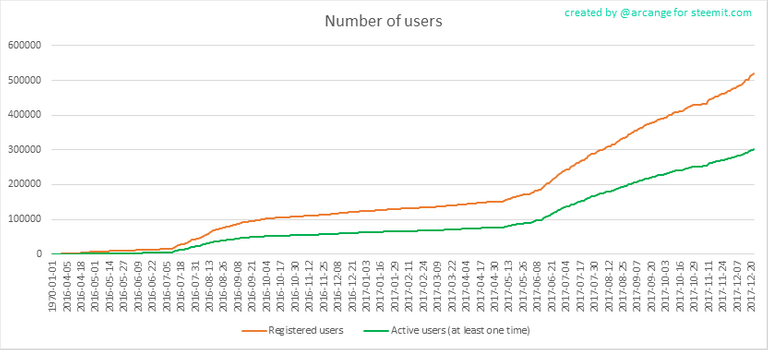
In this graph, the orange line shows the total number of registered accounts.
The green line shows how many of them have been active at least once (by active users, I mean those who made at least one post, comment or upvote). They are included even if they become inactive later.
2. Active users
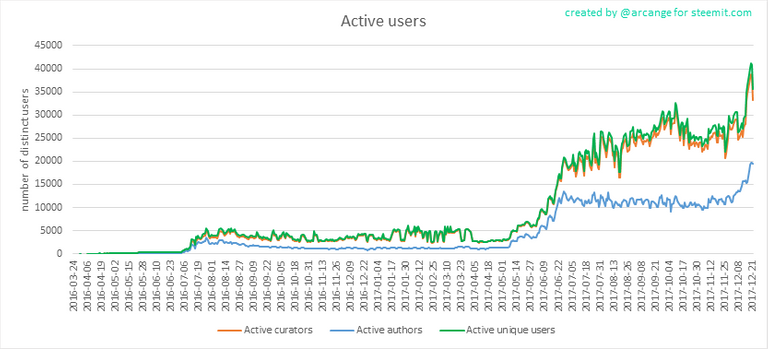
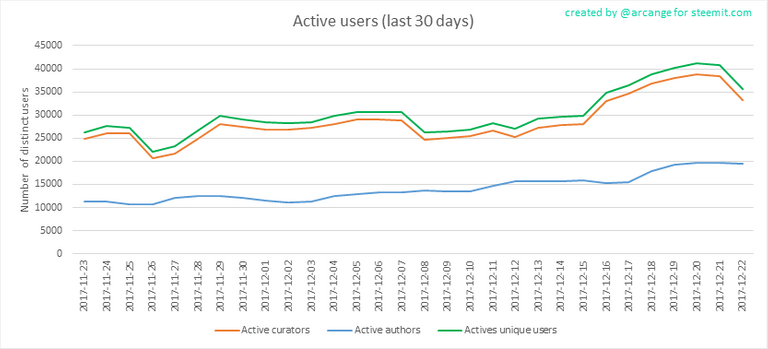
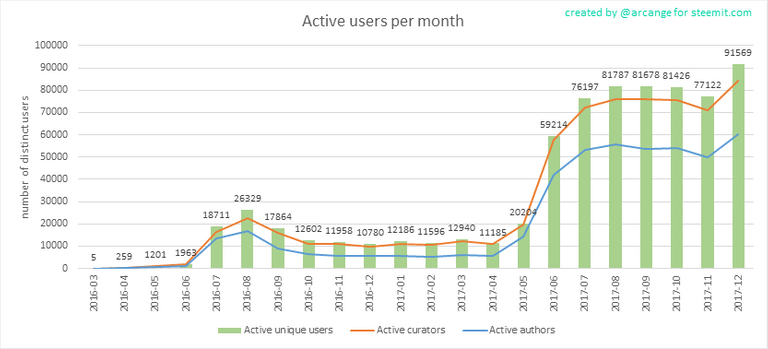
These graphs show the activity of users over time and in more details for the last 30 days. They use the same definition for active user as stated above.
The last graph is a monthly summary of the active users. It allows you to compare Steemit's values to those one usualy published by other social networks.
3. Posts And comments
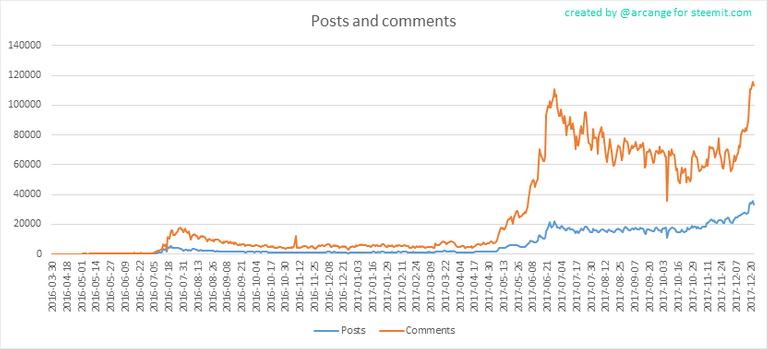
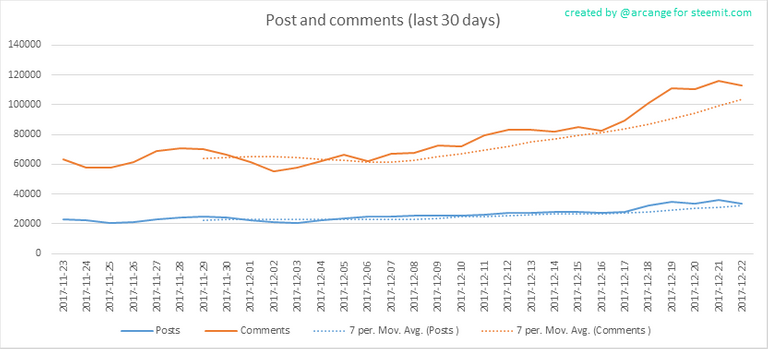
These graphs show the evolution of posts and comments for the whole blockchain lifetime and for the last 30 days.
4. Curation
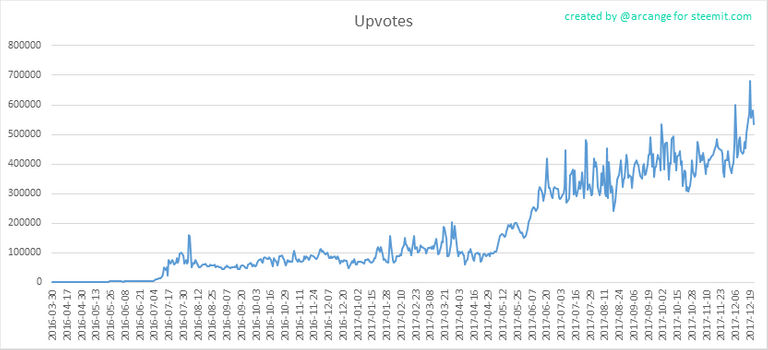
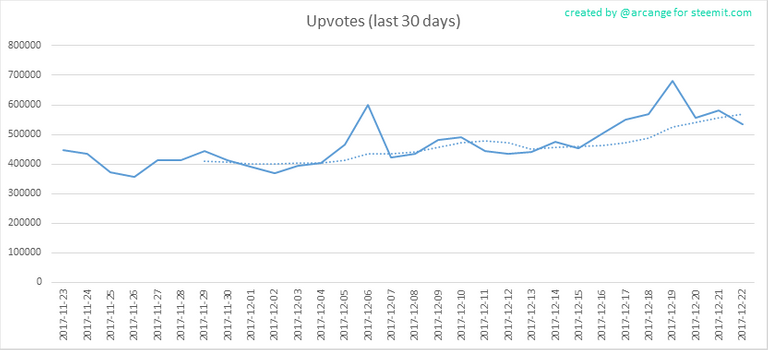
These graphs show the evolution of curation (upvotes) for the whole blockchain lifetime and for the last 30 days.
5. Daily transactions
![]()
This graph shows the number of daily transactions. This give you an idea of the whole activity on the blockchain.
6. Categories
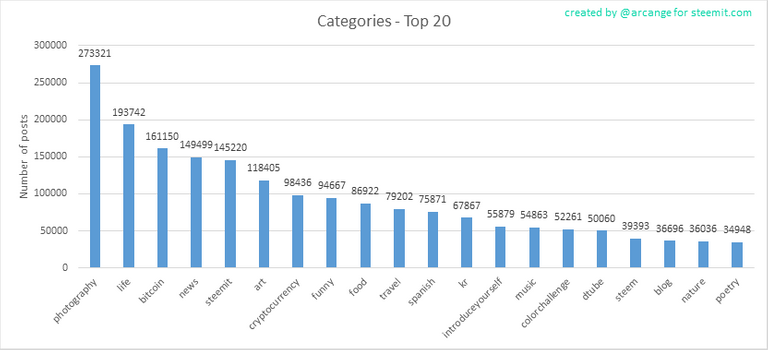
This graph shows the tag has been the most used for publishing posts for the whole blockchain lifetime.
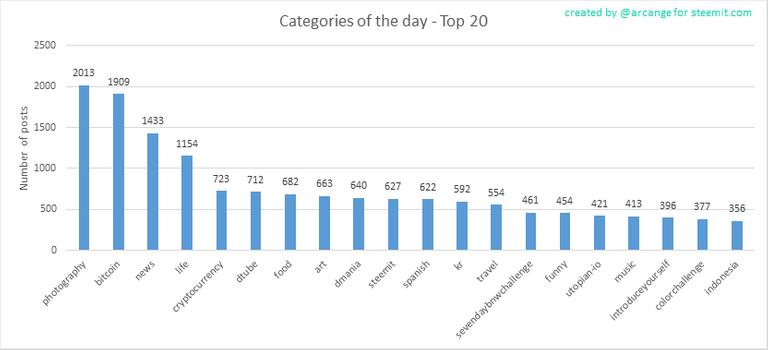
This graph shows the tag has been the most used for publishing posts last day.
7. Distribution
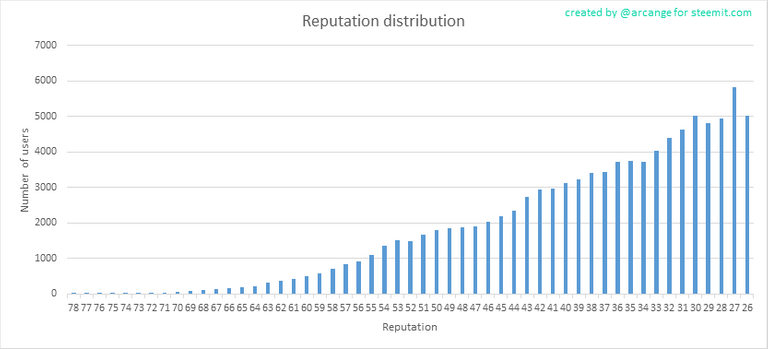
This graph shows the distribution of the reputation among users. Accounts with a reputation lower than 25 have been removed to keep the graph readable.
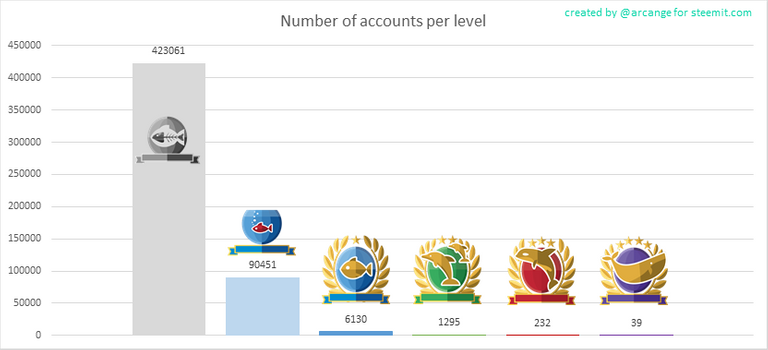
This graph shows the number of users according to their voting power (it now includes the new "Inactive" and "Red Fish" levels - check @steemitboard blog for more info about this).
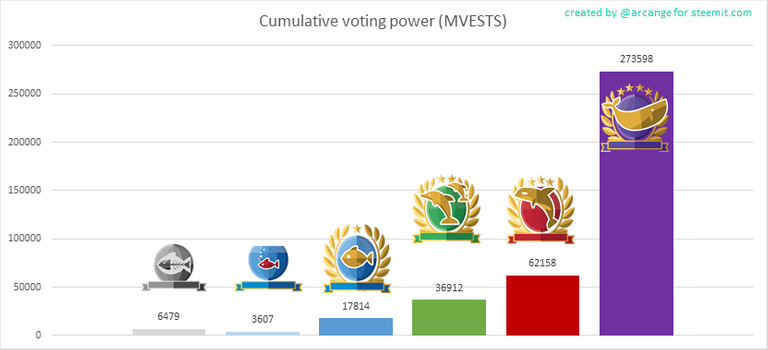
This graph shows cumulative distribution of the voting power. It enables to see the total voting power of each level.
8. Payout evolution
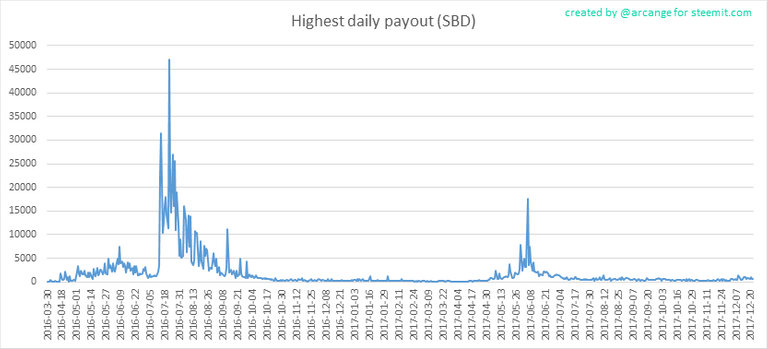
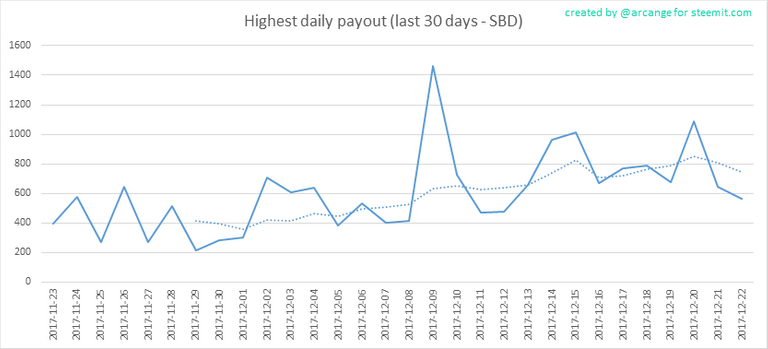
These graphs show the maximum reward paid on a post (or comment) for each day (whole blockchain life and last 30 days).
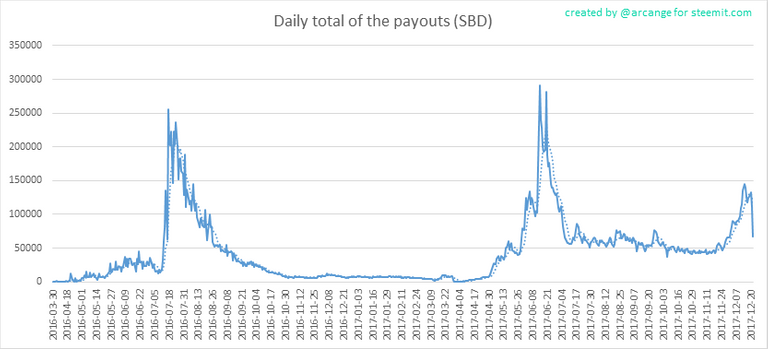
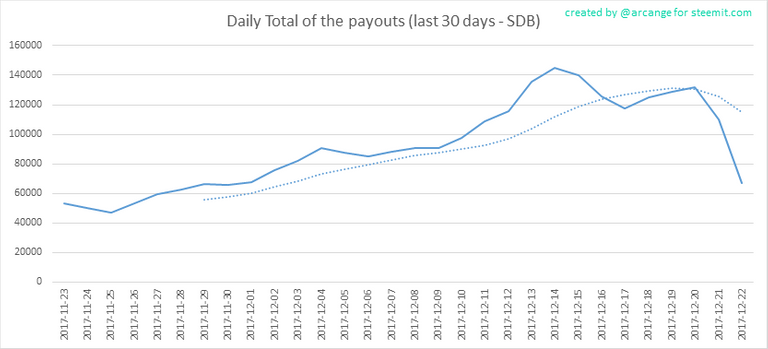
These graphs show the total of the distributed payout (posts and comments) for each day.
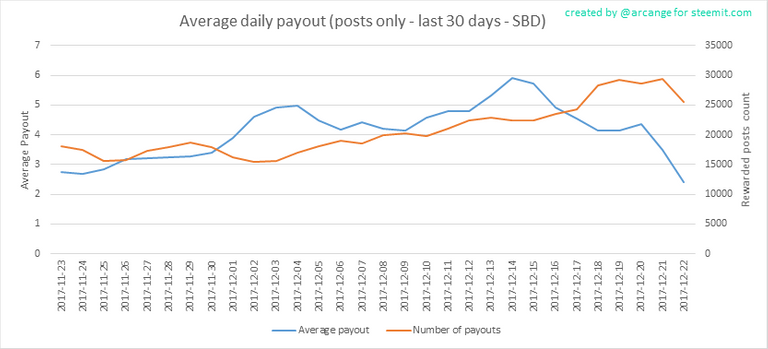
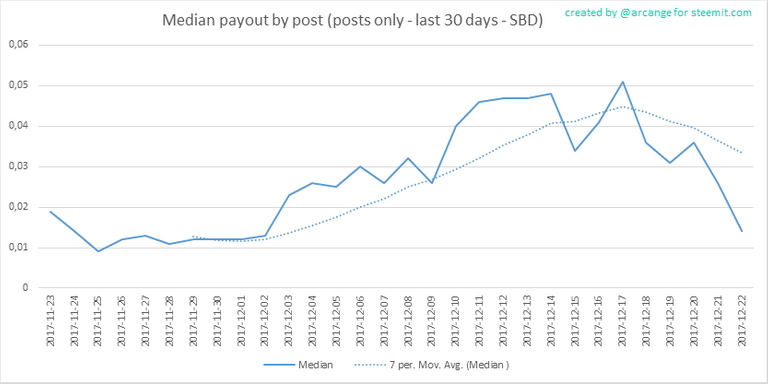
These graphs show the average and median payout per post for the last 30 days.
The last one indicates that if yesterday you got the latest value shown on this chart for your post, you should be happy because there are as much people that have earned more than you than people that have earned less than you.
I hope you find those stats useful. If you would like to see different stats, feel free to drop me a comment. Your feedback is more than welcome.
Thanks for reading.


footer created with steemitboard - click any award to see my board of honor
Support me and my work as a witness by voting for me here!

You Like this post, do not forget to upvote or follow me or resteem
Thanks to users like you arcange, steemit just pulls me in deeper and deeper. There is so much to learn and experience here and you've brought some more inner workings to the surface for me to explore and understand. Thank you.
Thank you for your witness vote. This is really appreciated!
I'm glad I found you solely because of the comprehensive and easy to understand nature of these stats.
Glad you finally landed here and it was helpful to you.
I would venture to guess that the reason there are so many new accounts that don't become active is because Steemit is not what they expected. Even if they are into crypocurrency, this site can be rather confusing. A lot of people just don't want to invest the time to learn about it. They think it's just a blogging site. When they learn more, they either get overwhelmed or quickly disinterested.
I'm new and find it fascinating. I think it's brilliant. It brings together techy folks with all kinds of bloggers. You can blog about anything that suits your fancy and be among some of the smartest mathematical geniuses on the planet at the same time. You co-mingle in the same environment. Smart platform decision on the part of Steemit.
I'm not a tech geek by any means, but I know just enough to be very interested in where this site is going.
Welcome to Steemit's ecosystem, with its diversity and a spot for everyone.
lol - diversity for sure. What is your take on the tanking payout numbers? Mine are sure going up.
Is it Christmas or the wild price changes or both or neither?
I'm glad I found you solely because of the comprehensive and easy to understand nature of these stats
What's up bro? Looks like growth is real good and wealth distribution is getting better too / peace good holodaize !
I love looking at the stats you post. I am wondering where you get these stats? If you could please enlighten me.
All data from these stats are taken from the underlying blockchain, using SteemSQL to compute and aggregate them.
Bonjour à vous, j'adore votre contenu sur votre blog, cet article est très excitant comme d'habitude je n'imagine pas le temps que vous prenez pour le faire. Je suis très triste que votre travail ne soit pas apprécié parce que vous méritez 100 fois plus de popularité et je pense que vous le faites par chance et j'ai beaucoup d'administration, je vous souhaite une très bonne journée et je me réjouis de votre prochaine article. Salut ami et porte bien;)