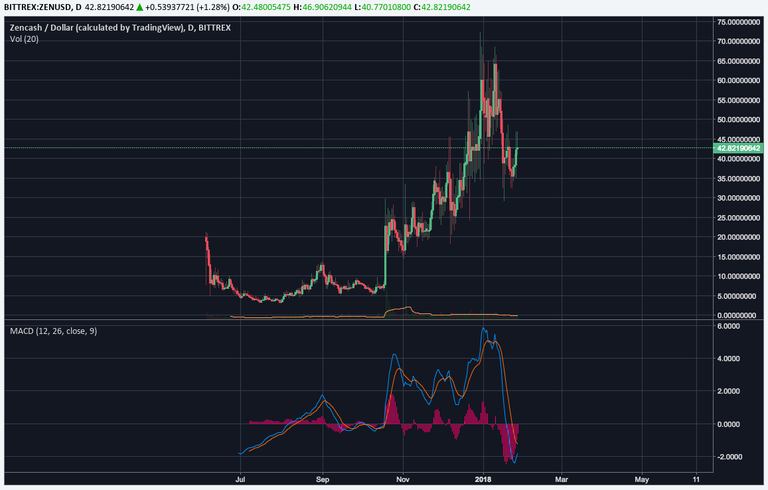
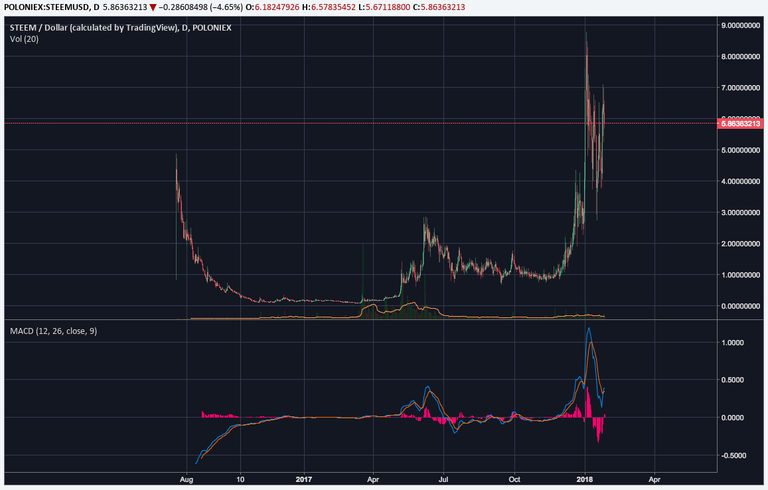
I've been looking over two of my favourite coins, Steem and ZenCash, and it's amazing how the charts are almost a mirror image of each other.
Both started out with a steep drop from an initial high, formed a cup and handle, dropped down again forming a second rounded bottom, before then breaking out to new all time highs.


The pattern forming in ZenCash looks like it's a couple of months ahead of Steem. We are approximately where ZenCash was in late October.
What's amazing is that even the price proportions are almost an exact mirror. From the initial high of $21 for ZEN, the top of the cup reached $13 in September, then bottomed again at $5, before jumping to $30 in late October. Compare that to STEEM with an initial high of $4.80, with the top of the cup reaching $2.80, then dropping back and again shooting up to a new high of $8.80.
We have even had a mirror of the first correction ZEN experienced after breakout out of its cup and handle, from a high of $30 in late October to a low of $15 at the start of November. We have just had corresponding drop from $7.50 to $3 in STEEM, with a rebound to $7.
If we map these same proportions out into the future, the recent all time high of $72 for ZEN in late December would translate into $20 STEEM, something that I think would make us all very happy!
It is about making you think from a different perspective..
Excellent post good analyses thanks for sharing.
Thank you for your comment @michelhenry!
great to share
updated
thank you
Thank you for your comment and your support @shawn4745!
your thinking is very great think,,,i agree with you..
excellent your steemit post