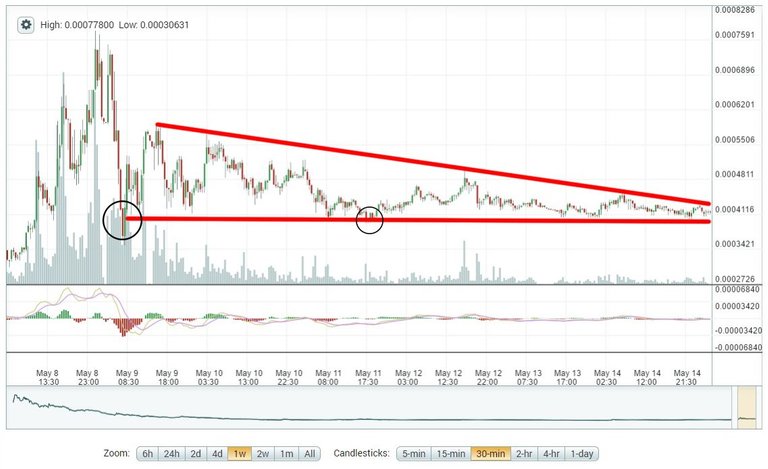
The STEEM-Bitcoin price still appears to be in a descending triangle and the price continues to get squeezed.
In my previous post, I pointed out this "wedge" and a support line in the STEEM-BTC price around 40K satoshis. I also stated that this line of support would be tested very soon...and it was. The price actually dipped just below that support line shortly after I posted. It didn't stay there for long, quickly recovering back to 43K satoshis. Since May 11th, the price has not broken that support.
However, the price has not climbed high enough on the charts to break the current downtrend and the wedge continues to put pressure on a break, likely downward.
We can see in the first chart here that there was an immediate break of the 40K support line after the local highs on May 8th. We see a second break that barely brought the price into the 39s, but mostly a STEEM-BTC price that has remained above support. And there is also a very clear descending triangle that is on the verge of breaking.

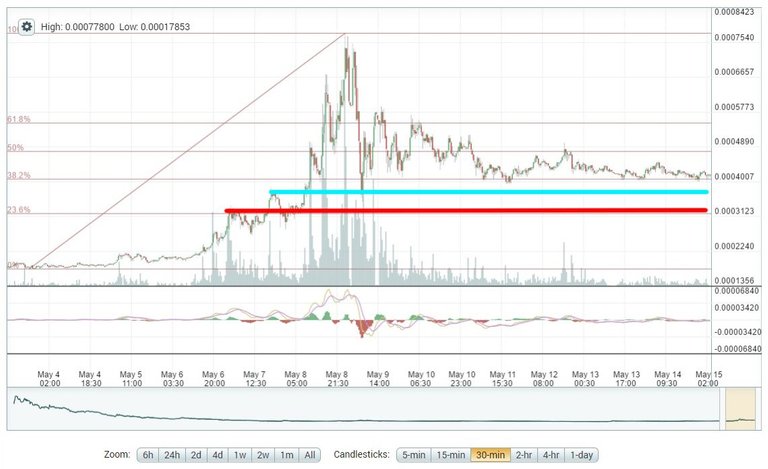
The current support line is resting on that 38.2% Fibonacci retracement line as well. If the price breaks down, I'm still looking at some light support around 37K satoshis (blue), but stronger support and likely the near-term floor at 31K (red), which is also "confirmed" by the 23.6% Fibonacci line.
Also notice the continued decrease in volume, which typically does not bode well for prices.

Looking at the Poloniex depth chart isn't too encouraging, but there may be a little room to run upwards. However, it's a short window.

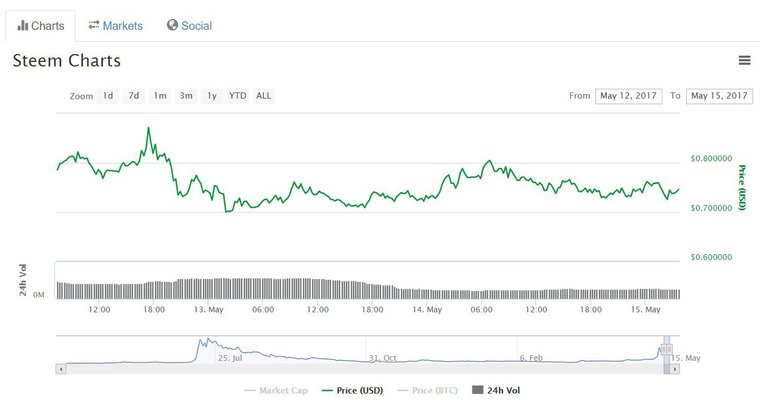
The STEEM-USD price has bounced between $0.70 and $0.80 for the last few days. There aren't many STEEM-USD markets, so this price mostly just reflects the value of STEEM, relative to where Bitcoin is trading in U.S. Dollars. It will pretty much follow wherever the STEEM-BTC price is going.

Where is the STEEM price going?
To me, the indicators appear to be pointing to another leg down, even if it's brief or shallow on the charts. I think we might see it at least test the light support at 37K, possibly in the next 24 hours of posting this.
If the price can clear 43K satoshis, then that would be a good indication that the STEEM-BTC price is building strength at current prices and may end up range-bound for the near-term. Piercing this price soon would be a clear break of the wedge.
If the price can clear 47-48K satoshis, I'd feel much better about range trading. Making its way to 52K and above would be a good indication that the price does not intend to trade back down toward the current support line in the near-term.
If you're trading, always remember:
Never invest or trade what you cannot afford to lose and put tight stop-losses in when prices creep lower towards the support lines.
As always, if you have any critiques or comments about my non-professional analysis, please let me know. If you decide to trade this market, good luck to you!
Disclaimer: I am not a professional adviser and this info should not be used for trading. I would be flattered that you think so highly of my fairly basic analysis, but it would not be prudent to use this for transacting with real money.
*Charts are from Poloniex and Coinmarketcap.com. Analysis is current as of approximately 12:30am EST, May 15, 2017.

On the daily chart we are in a consolidation after the last leg up. So long as we hold this consolidation area steem is setting itself up for another bull flag. Things look more bullish on the daily than on the shorter time frames, luckily larger time frames hold more weight. However, until it pushes above or below this consolidation area it's essentially a coin flip. Though price action has been positive in the past month so it makes it path of least resistance.
Well, the STEEM-BTC price hit my first upside target shortly after posting last night and just punched right through to upwards of 49K satoshis, so it looks like we might be heading for some range trading. We'll see how the rest of the day plays out. Could be time to make some money trading again!
Good job David - making its way to 52K and above would be a good indication that the price does not intend to trade back down toward the current support line in the near-term
Thanks for the analysis, interesting. I am following @leongkhan analysis for some time and what I find interesting about those is the fact that it also takes into accounts some fundamentals, like power downs / ups trends or total number of accounts. I do believe there's truth to be discovered in technical analysis, but a broader perspective, using fundamentals, can be more supportive in trading.
With that being said, I'm bullish on STEEM/BTC, based on what I perceive as being a new influx of money in crypto, generally speaking, an influx led by the Bitcoin starship, in which more traditional traders are dipping their toes into a range of various cryptos. Among cryptos, Steem has a lot of advantages (speed, zero transaction fees, zero mining power required to mint, etc).
As usual, I might be wrong.
Yeah, I was putting that in my posts, but haven't in the last two. I'm not sure that powerdowns have that much influence on prices anymore. Most of the larger whales who wanted out have already divested. And the last time I looked, total powerdowns was a fairly small size compared to the liquid market. I'll put them in occasionally if there are any large spikes, but I just don't think they're going to move prices much at the current rates. The larger trading market is taking over - and, as you said, there's a bigger influx of money into the markets overall.
@ats-david, I track power downs and active accounts as an indication of long term trends (weekly) . I believe that the technical analysis (price patterns, volume, and momentum indicators) are geared towards the shirt term (intra-day or daily). The crypto market is too new and immature to make the quarterly projections more commonly seen on Wall Street (IMHO). Putting the short and long together gives you enough information to trigger informed trades. That's my opinion, but I'm open to improvement.
It actually looks like a consolidation of rise and its preparing to rise again. Rather than a bearish wedge its a triangle waiting to be broken upside.
Yeah, it's certainly consolidating, there's no doubting that. The question is whether or not there is room for another dip below current support. Even within a larger bullish market, you'll find bearish patterns. That's always something to keep in mind about the context of these posts. These are mostly posts about short to mid-term price movements.
And if the price is going up, I'm OK with being wrong about where I think it might be heading. Right now, it appears to be breaking out. It just cleared all the way up past 48K satoshis. If it can hold above 45K now, I'll be good with that.
Thanks for the comment.
This is very informative. However I have one critique, the wasn't enough tequila or knives in this analysis :0D
:))) quite.
TA while drunk!
Those are the best ones!
Thank for sharing! I am interested to find out your thoughts on whether we are in a cryptocurrencies bubble now? Here is the DATA which support this my assumption: it looks that we are entering bubble territory for a vast majority of alt coins (except Bitcoin probably). Just think about and analyze the following facts:
At least several dozens alt coins market caps skyrocketed 300%-4000%(yes, four thousand!) recently just over last 2 months!
The beginning of sharp increase happened around middle of March of 2017 for ALL alt coins!
Yes, some alt coins sharp increase is logically justifiable. For example, Ripple XRP: http://www.cnbc.com/2017/03/01/japanese-banks-plan-to-adopt-blockchain-for-payments.html . Maybe there are couple other alt coins where this huge growth is also justifiable.
But for vast majority of other alt coins nothing has changed drastically during the last 2 months! At all! Neither in their technologies development, nor in their business development! But nevertheless, their market cap skyrocketed 300%-4000% in just 2 months!
The only explanation which comes to mind is that huge amount of new capital is coming to cryptocurrencies market. Probably these are the people/investors who have heard about the first wave of Bitcoin and Ethereum successes, and they have a FOMO (fear of missing out) now. They don't have deep understanding of cryptocurrencies space and their differences, but because of FOMO they still invest in all other alt coins hoping to hit jackpot!
Does it remind you anything? Yes, exactly, dot com bubble of 2000 looks very similar!
Therefore, I would expect some kind of significant downside price correction within next several months for the majority of alt coins. Would you agree?
Theoretically, won't 5-6 whales be able to draw that pattern if they so wished?
Theoretically, one whale could do it. That would just depend on the size of the whale.
Don't you think this is rather the rule rather than the exception? And if that thought holds, then isn't it meaningless to analyze patterns?
I don't. For someone holding a large number of tokens, it wouldn't make much sense to force the price down. If anything, they would push it up so they can dump, then quickly re-buy for another pump-and-dump later.
A slow, gradual price decline doesn't tell me that there are a few people colluding to decrease their net worth. It just tells me that there isn't much interest in buying the token at the moment at the market prices, for various reasons. There was a rather quick spike in prices. A slower correction is expected until a new floor is found. It could be at current prices or it could go lower. This isn't really anything outside the realm of asset/currency markets.
And I don't think it's meaningless to analyze patterns for pretty much anything. But recognizing patterns is what trading is all about, whether those patterns are a result of collusion or not.
We should see a breakout in either direction soon. 4 touches of the trendline.
If it does dip it would only be for a shortwhile; perhaps a week or longer. The 1 day support looks very good right now suggesting that future prices will be much higher, so any dip should present itself as an opportunity. You don't want to be selling when you should be buying...
I'm in agreement with your analysis. Btw, I am giving away 1 ETH, check my blog for details. Thanks
Great analysis. Thanks for sharing :)
Looks like you had it pinned. Currently at 52k and on an upward trend!
Thanks for the informative post!
Interesting post. I was about to start a similair discussion. I do believe most coins are currently overrated. But the future lies in blockchain. Besides coinmarketcap.com there is: https://www.coincheckup.com Amazing opportunities came to light when I started using this coins to analyze cryptos.