Hello all,
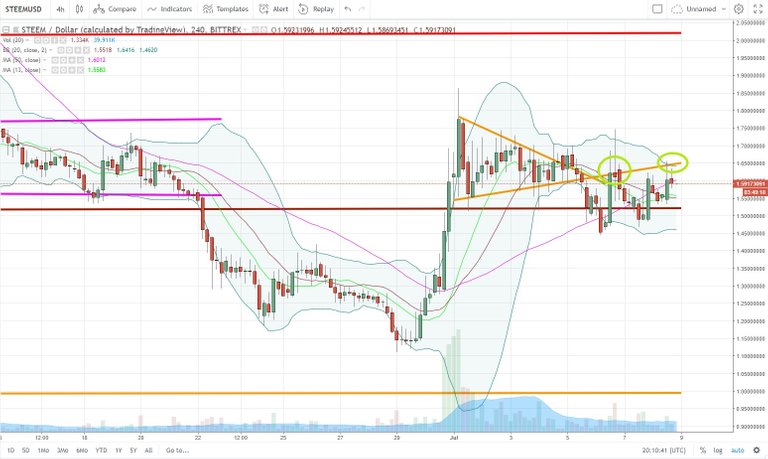
Here is the chart of yesterday :
Here is the current chart :
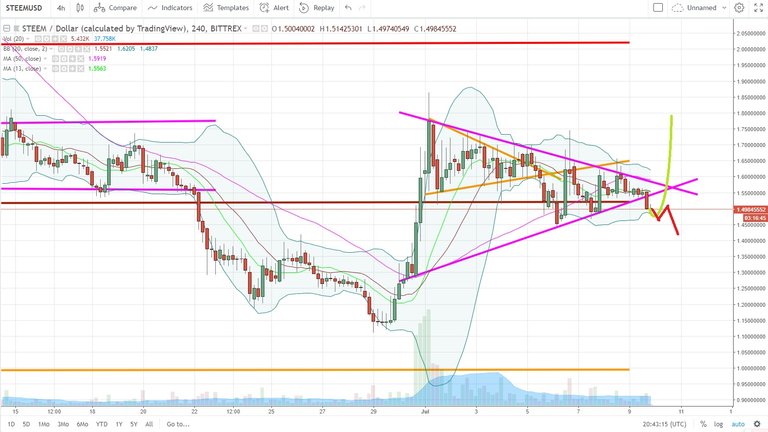
Here in pink, I draw you a bigger triangle which is currently in action. We just broke it by the low but everything is not yet lost. We have sometimes this kind of pattern (bull wick) just before a nice UP.
I draw to you the 2 main scenarios :
- In green, we have the bull wick which will send us back inside the triangle which will trigger a break by the upper line
- In red we have a continuation of the current break by the low.
I wish you massive profits,
Cryptopassion.io
Disclaimer : Never invest more than what you can afford to lose. This post is my personal opinion, do your own research before making any investment decisions. If you make any trades after reading this post, it is completely in your responsibility. I am not responsible for any of your losses. By reading this post you acknowledge and accept that.

Do you want them spendable directly via a dedicate plastic Visa card ?
Do you want receive back 0.5% of your spending in Bitcoin ?
I recommend you the platform


I hope the breakout is to the upside!
It may fall a little more before rising , getting scary out here
I wanted to thank for the charts and analysis. I have been using the information to and my own views of the charts to strategically add to my long term holdings of steem.
thank for the charts and analysis.
Hey, good one. Have you considered the formation of a down-channel?
It seems to explain quite well the recent action of the market.
Good luck!
nice analysis of chart.thank u so much.
Really this time profitable time for investor
Never invest more than what you can afford to lose. Every Trader should always remember this sentence.
Thanks for this post.