Hello all,
Here is the chart of yesterday :

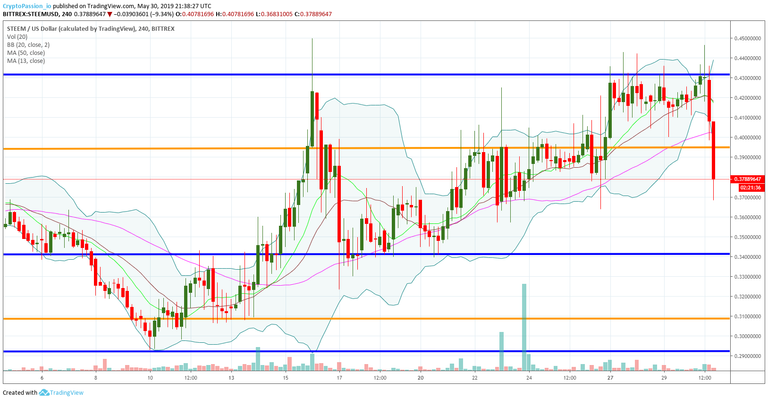
Here is the current chart :

The STEEM is doinga lso a reversal, following closely the pattern of the BTC. We are currently testing the resistance line at 0.39$ that we broke down during the correction of yesterday.Let see if we will be able to break it and go back inside the trading canal between 0.39$ and 0.43$ where we were stucked since some days now.
I wish you massive profits,
Cryptopassion.io

Legal Disclaimer : Never invest more than what you can afford to lose. I am not a financial advisor and the content in this article is not a financial advice. This post is for informational purposes only and provides only my personal opinion. It is important that you do your own research before making any investment decisions. If you make any trades after reading this post, it is completely in your responsibility. I am not responsible for any of your losses. By reading this post you acknowledge and accept that.


.gif)

.gif)
Really, please, explain better
Posted using Partiko Android
Tell me about what you need more explanation?
If you want an in depth detailed report.. you will probably have to study so that you understand posts like the ones @cryptopassion publishes:
Chart School:
https://stockcharts.com/school/doku.php?id=chart_school
You can also subscribe to @dollarvigilante's Premium Newsletter but it costs money 👍
Thanks for votes 🙏🙏🙏
Posted using Partiko Messaging
Thank you