Hello all,
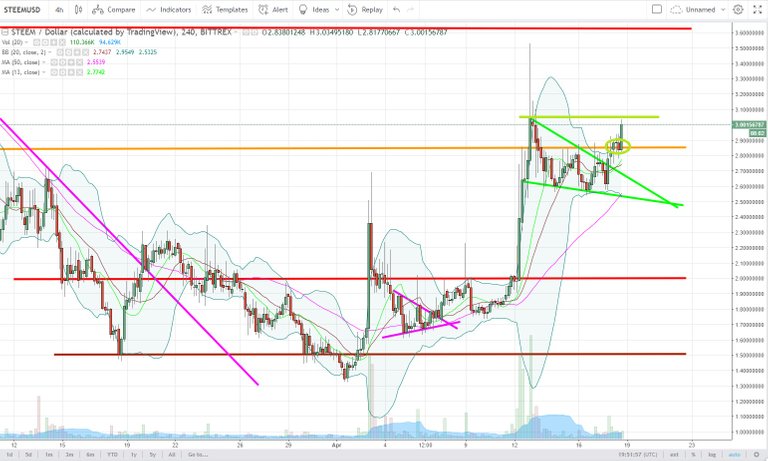
Here is the chart of yesterday :
Here is the current chart :
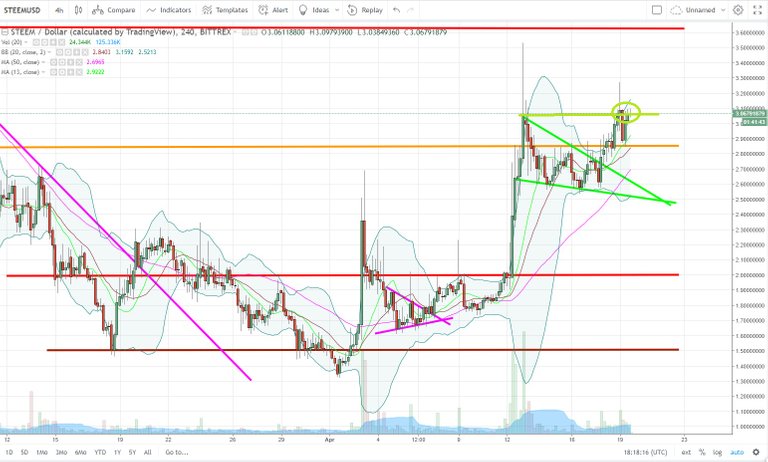
As I was explaining you, we have a resistance line around 3.05$ and we are still currently trying to break it. The first break of it created a pull back and we went directly on the support line in orange. That suport line played well her role and helped us to go test again the resistance line. We are still exactly on it at the time of this article.
If we are not able to break it soon, we will see a correction taking place. As I'm expecting also soon a correction on the BTC if we don't have an increase of volume, I don't think we will be able to break the current resistance line on the STEEM neither but let's take a look on that line and on what will happen.
I wish you massive profits,
Cryptopassion.io
Disclaimer : Never invest more than what you can afford to lose. This post is my personal opinion, do your own research before making any investment decisions. If you make any trades after reading this post, it is completely in your responsibility. I am not responsible for any of your losses. By reading this post you acknowledge and accept that.

As a trader, I recommend you the trading platform Bitfinex
10% discount on your trading fees for 1 month via this link !
With my daily exchanges of cryptos, I can recommend you the platform Binance

Help me ,please one vote on my post
Thanks friend
Your charts are still the most precise and for me the most logical ones I see here on Steemit. You are spot on - without all this fancy "waves and fibro" stuff, that doesn't work with crypto obviously. Thank you and let's hope, that the correction will only be a minor one, before we break the 3.05!
Maybe we won’t break it on the first attempt but it’s likely after several tries.
Steem is the future .. Bro....
Need some high spikes to break the resistance line. I wish to see steem at $4 :-(
The alt rally is so strong this week. I keep waiting for a break down to buy more but it hasn't happened yet.
Steem is a great investment. The volume isn't too bad for BTC now. It seems to be going up as the price rises. It is still low enough that a big seller can come in and push the price down.
You can see a nice Cap and Handle pattern on the 1h chart showing the rebound you mention on your post.
It's all cryptocadabra to me but carry on, one day I will see the light. lol
Just do what I do
Green --> good
Red --> wait for green collar again.
this is good to know ...it is informative thanks @cryptopassion
I need follow , Recruiting people to help each other
hi~ subject of the my channel is comedy and issues
If you follow me, I will do you, too.
thank you .!!
Steemit is sure to succeed!
breakout coming :)
Please be aware that institutional traders know conventional technical analysis but they dont use it to make trading decisions. Instead, they use it to determine where retail traders are going to be and then they move price to stop or shake you out. Think about it...who makes all the money in markets: large speculators or average Joe traders? Who can move price with volume? Please be careful using conventional chart analysis when forming conclusions.