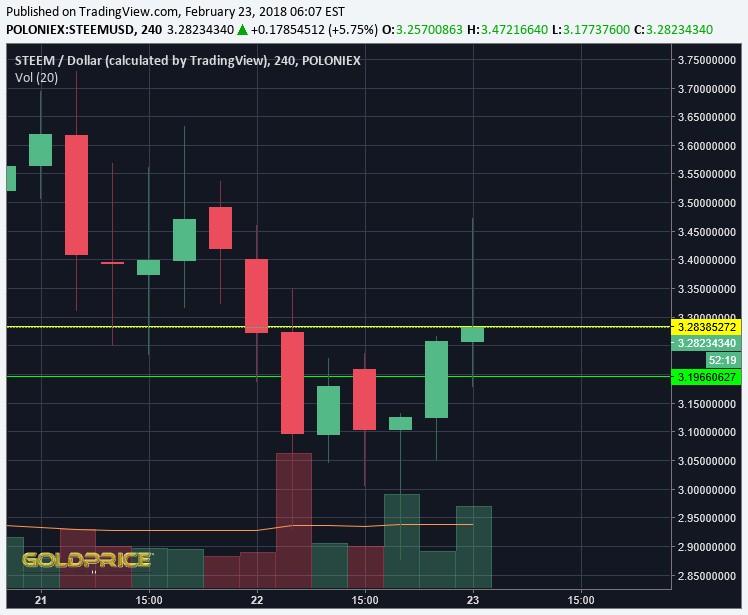
Yesterday I posted a price review of Steem. In the post I included a 4 hour chart of the Steem price.
At the time I predicted a bottom. Here is a 4 hour chart that shows the price change since then (last 6 bars).

I picked the bottom where the green line hits the red bar (counting bars from right to left -#6). You can see the price continued to fall. Then return to my buy price. Then drop again. Then sink even to a lower low (the long green tail). Then finally go up over my buy price.
This up and down action causes me great anxiety. I don't need more stress. Therefore I do not trade.
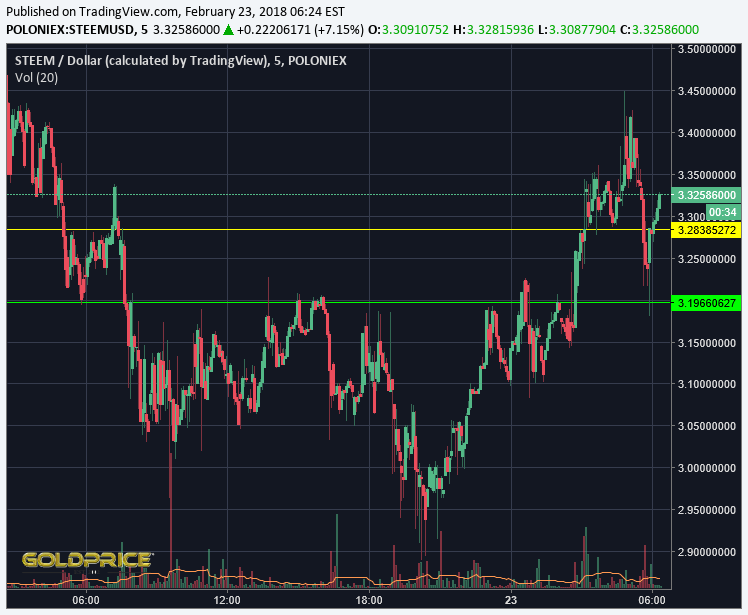
Below is a 5 minute chart of the action since yesterday. Every bar below the green line would have been stress for me.

I believe in Steem, but I am not emotionally built to trade.
Here is today's beauty.


Trading is very risk! That's way i am agree to trade business.
You are right my friend, wish you all the best..
Have a nive day
I normally find it very difficult to understand graph charts but with the few line drawn on it I get a little bit of idea but I seems not to understand why it unstable. Always looking forward to your day beauty but it always beautiful and natural.
Kupu2 nya nice
How i wish, i know to read charts. You do not trade because you understand charts and price movements
How can i learn @doctorjohn?
I like youre all poste thanks forshairing
Nothing on these charts seem real to me. They are all abstract and i do not know where to start from to decode something small for my understanding. How can i learn this and from where @doctorjohn?