UPDATE
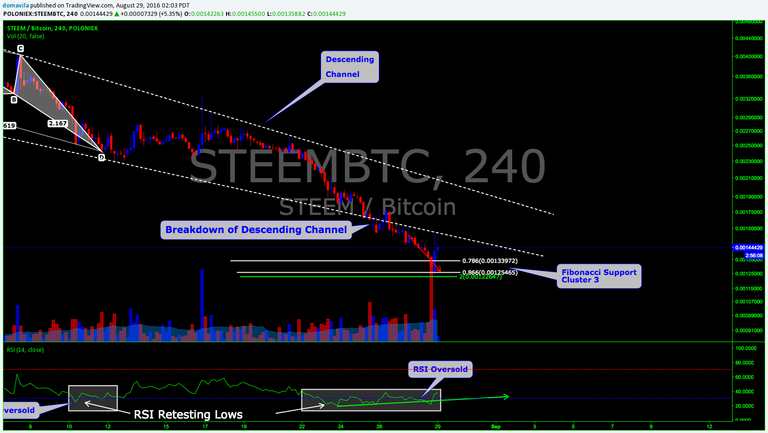
After price dropped and stopped at the last Fib cluster we had a nice bounce at support. This was the main level I was looking at. Notice how price followed the red down arrow and then bounced at support?
Lets see if it can last.
View Image

After price dropped and stopped at the last Fib cluster we had a nice bounce at support. This was the main level I was looking at. Notice how price followed the red down arrow and then bounced at support?
Lets see if it can last.
View Image

I will be looking at the daily for a clear reversal - then look to 4 hourly for trade entry
Good call on that fibs cluster!
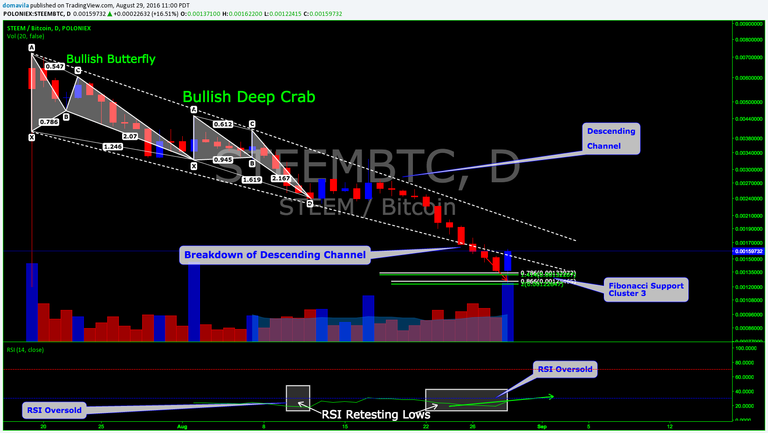
We might get a daily bullish engulfing candle, which I assume would at least lead to some sideways (ranging) price action for the next few days. It could also mean that a bottom is in (although it likely needs testing after such a long movement downward - double bottom)
bullish engulfing candle on the daily, looks good.

View ImageRight on @jamesbrown, thanks. So far so good, we could see a retest of the lows like you mentioned and if it holds we could see a reversal in the area. Thanks for pointing out the