Am I interpreting this correctly?
.......................................................................................................................................................................
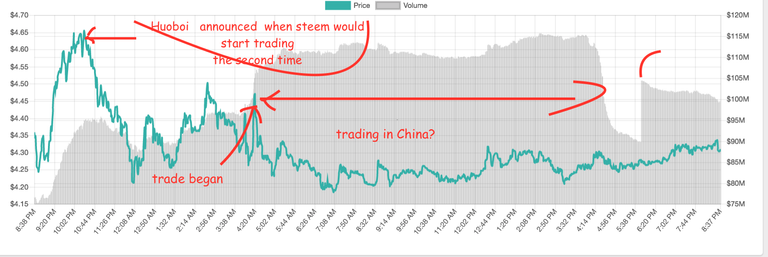
From the chart...it would seem that when the latest exchange that Steem was listed on finally began trading after and earlier no go, the demand was strong.
It averaged $100M...for seventeen hours then the volume declined (they went to sleep?).
Then it picked up...not as much, but the price started creeping up.
Is that because the 'west' woke up and started trading?
I dunno.
I just noticed. It might be nothing or it might be something.
Only time will tell.
Stay tuned.
It is something... It is something...I keep telling myself that
it's always something ain't it?
Is right. We are on a rise and fall, but I am confident that the steem will finally rise and remain at the top of the cryptocurrencies. God want
the TOP is BitCoin..which is currently at $9300.
BTC dominance is going down though.
Yes it is..last I checked it was 'only' 38%.
At one time it was 100%
Starting to sound like the dollar ;).
Indeed, but what we are witnessing might be also seen as BTC making room for the other players in a nascent technology.
With these other players at liberty to show their worth and utility.
The utility of BTC is still very strong, part of the strength seems to lie in the trustless features which Bitcoin ushered in.
Anyway it's a fascinating ride this year so far, I expect it to get even wilder!
So he's a friend, I follow his interesting analysis.
blink?
this coin sibe like foam will keep me looking at your post to be informed
I really admire you alot sir.. Wonderful post from you again..
Great analysis
Thank you for the valuable informations.
By how this part of the graphic looks like, I believe it is a whale or two trading a huge volume, or I can't explain how it changed so dramatically in a matter of minutes...
But I guess that you might be getting it right, it can be a time zone specific graphic, but only on volume, that does not mean that the price is influenced in any predictable way by it...
nope..I don't understand it.
that was just my swag (scientific wild ass guess)
I believe it is a whale or two trading a huge volume
rilly, rilly YUGE...$115 million Yuge.
I don't know for sure, it's just a random guess, maybe I am wrong :D