Steemit is demonstrating very definite and measurable phases in its evolution.
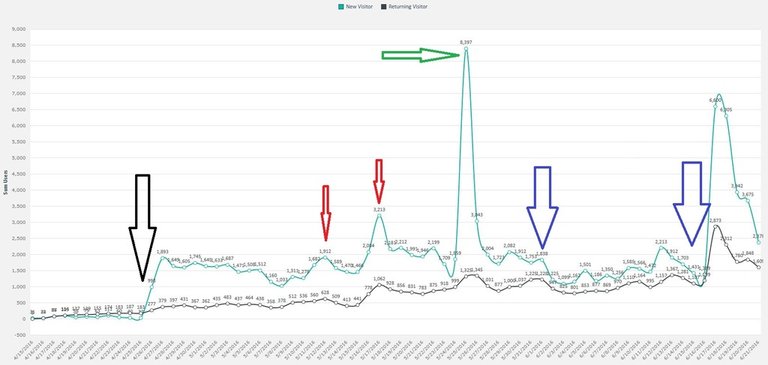
These transitions are highlighted by the different arrows in the picture below.
Overall steemit traffic till the 21st July

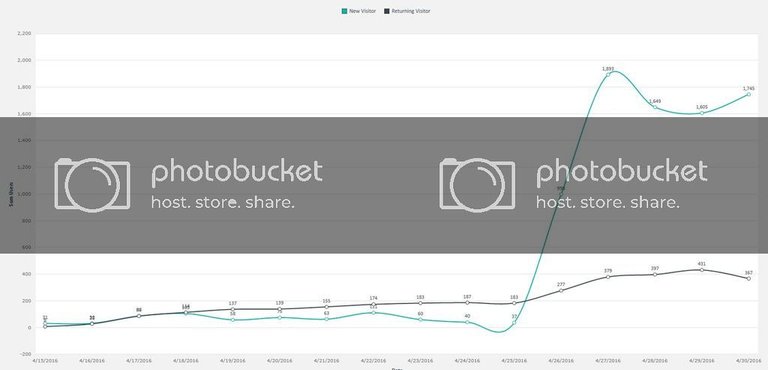
Phase 1 is from the start up till the black arrow. This is the initiation phase where the inner circle are the ones active on steemit with very few new users per day and very slow growth. On the 26th Steemit is discovered by the outside world - Brazil of all places - by this is misdirected traffic with a high bounce rate as demonstrated by the huge gap between the blue and the grey lines. New users get to the site, don't find what they are looking for and then leave immediately. The real traffic is demonstrated by the steady rise of the grey line.
April steemit Traffic

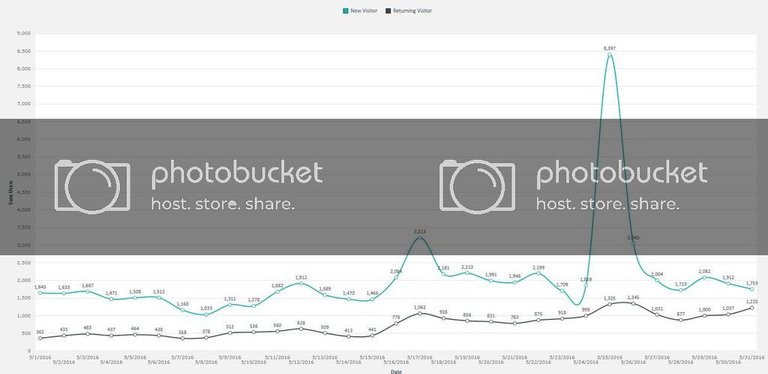
Phase 2 shows steady organic growth punctuated by instances where new users peak due to steemit articles being featured and linked to elsewhere on the web (red arrows). The highest peak marked by the green arrow is when this post was featured in hackernews:
https://steemit.com/crypto-news/@dan/is-the-dao-going-to-be-doa
May steemit Traffic
In may returning users per day more than doubles from around 400 users to just over 1000 users per day.

Phase 3 is demarcated by the blue arrows. it indicates a phase where bounce rate lowers. and the difference between the new users blue line and the returning users grey line narrows.
This indicates that more new users are being converted into returning users. This is great news for steemit and indicates that the user front end is maturing.
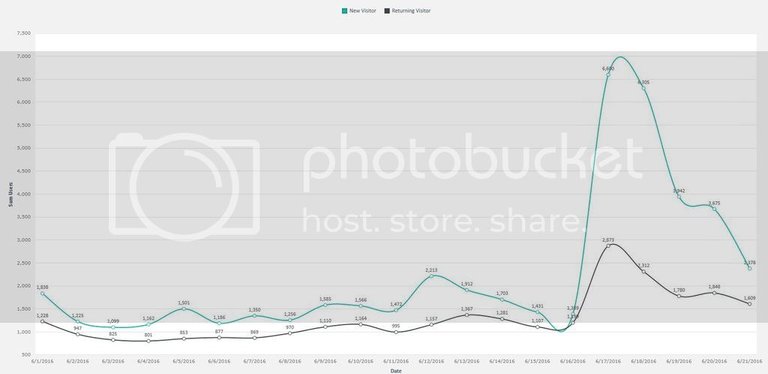
June steemit Traffic (till 21st)

In the last week we have seen a further indicator of maturity.
In the past we have seen a sharp spike with a rapid drop off and only a gradual lift in returning users. Now we see a wider peak with slower drop off and a much higher conversion rate from new users to returning users.
The traffic has also been coming in from more divers sources.
- Search engines
- etc
Returning users per day is well on the way to doubling again by the end of the month.
Well done devs!... the front end is better at retaining new visitors and well done promoters!.... the traffic flow is broadening and deepening.
Thank you again @gavvet! This is another great analysis. The platform is maturing. It's growing so fast!
Thanks, by the end of the month, there should be enough for Machine Learning algorithms to play with. The we can have some forward looking graphs ;)
I think you meant "June Steemit Traffic (Until 21st)"
Nice catch, checking if anybody actually reads the detail (its my story and I'm sticking with it) will rectify now.
Team work makes the dream work :-)
Putting July in instead of June just demonstrates my eagerness to have more months behind us and hence more data. I can't wait till there is enough data to do some serous predictive analytics and forecasting.
Wow, what an efficient explanation! I may be drinking the cool-aid, but it seems as though Steemit isn't just demonstrating healthy growth, but an ability to encourage its users to create unique but interesting posts. I can even see that in how it guides me decisions regarding how and what to write. Thanks for the post. Very interesting
Great Article!
It's awesome to hear the good news that Returning Users is about to double by the end of the month! I was honestly worried that we might not get enough content looking at the "new" part of Steemit everyday. :D
Thanks for this great data and analysis! I am very happy to see how well steemit articles are doing in the search engines. If I Bing or Google a steem post title, even a very new one, it always shows up in the search results, in my experience. Being well indexed by the search engines will bring more and more visitors to our Steemit posts!
Well done! This is fascinating!
Let's ee the future now!
I know that feeling!!!
We just need to move past this current bump and then the predictive analytics can kick in, right now it is too skewed by the hump of last week.
Simplified infographic

:)