Could Steem Dollar be heading to higher prices?
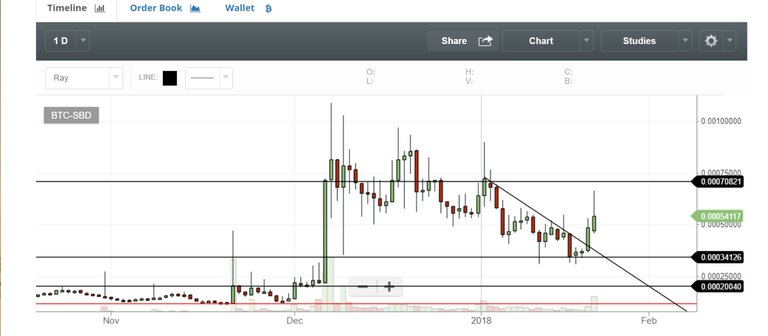
The 0.00034126 SBD/BTC level that was established on 9 December 2017 and retested on 16 January 2018 held strong. Buyers were able to push the price up from that level. Additionally, there is a breakout from a short term trendline.

From a technical standpoint, there is a high probability that we will test the 0.00070821 SBD/BTC level. Once that price level is reached it will be battle on between the Buyers and the Sellers. If we can close above the level, with conviction, then we can expect higher prices. If Sellers win the level then we can expect a retest of the 0.00034126 SBD/BTC level and possibly a test of the 0.00020040 SBD/BTC level. Either way the 0.00070821 SBD/BTC level might be a good area to cover any longs and possibly enter some shorts with limited stop losses.

This article is intended for educational purposes only and not meant to convey any financial advice. Trading can be a risky venture and personal due diligence is required.


It will go sideways for a few more days, as we get closer to the full moon, you will see some build up for a bull run. This at the end of the month. Even after the full moon will rise a bit more. I would put some Bollinger bands, not on that graph, but on a Steem/USD one, as you see them really narrow, wait for an upward breakout, if it happens, buy.But if it happens downwards, sell every coin you have, that's a crash.
I always found lunar cycles and price fluctuations fascinating but for me it was a rabbit hole that just lead deeper and deeper (i.e. combining lunar cycles with fibs, what effect does Mars have, etc...) and ultimately became too confusing for entry.
Personally, I prefer looking at known levels where I can see buyer and seller activity. But whatever works right, I know people who are successful trading lunar cycles.
The moon is like a supercomputer in the sky, it controls everything down here. And technical analysis is only usefull to find entry and exit points, keep that in mind.
I'm seeing the same thing. Currently the price is riding a really nice rising trend line, but the momentum is dwindling quite a bit (as you can see by your chart as well). A huge wick towards the top like that would most likely mean that we'll see price test a support or two before the next rally, meaning it'll get worst before it'll get better. Great analysis!
I have some limit orders in near the previous support....hopefully we get a retest
I believe the SBG will reach really high prices considering so many are investing in steem itself and (SBD) is a subsidiary of steemit so Steem is more lucrative. But Judging by the analytics from above i believe their right.
I have noticed people sharing more and more steemit stories in their Facebook profiles and on Twitter. If it can gain more widespread acceptance then it should go a lot higher....but that is a fundamental view. I am more of a technical trader...but I hope it does gain more acceptance.
Agreed. I try to spread the word as much as i can. It's a really cool platform and i'm in it for the long haul. Only been a part of the community for about two months now and i show no signs of letting up.
This post has received a 4.03 % upvote from @boomerang thanks to: @opietaylor
This post has received a 2.34 % upvote from @booster thanks to: @opietaylor.
Steem Bot Tracker websitevote for @yabapmatt for witness!You got a 0.71% upvote from @postpromoter courtesy of @opietaylor! Want to promote your posts too? Check out the for more info. If you would like to support development of @postpromoter and the bot tracker please