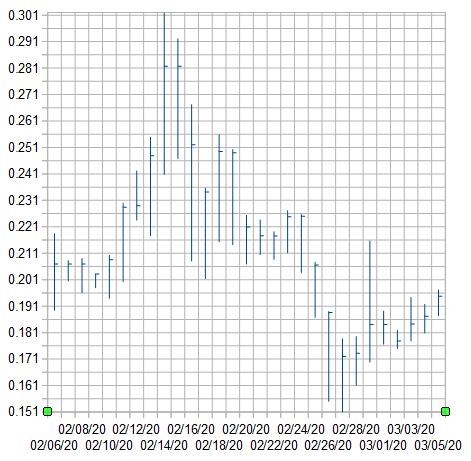
Creating STEEM Price Grids as another way to see price value over time.

Idea of creating there "price grids" for STEEM and other crypto(currencies) if there may be interest in so. Will be sharing a simple short term chart initially with more to come!
STEEM grid shows prices over the period of the past thirty (30) days, from 2/6/20 to 3/5/20 between a low of 0.151089 and a high of 0.301778 with a "squarer" perspective to help better visualize price change as opposed to elongated charts we are used to seeing which may distort our view or price.
Comment below if you are interested in this "price grid" idea and if you would are interested in seeing "price grids" for other crypto(currencies).