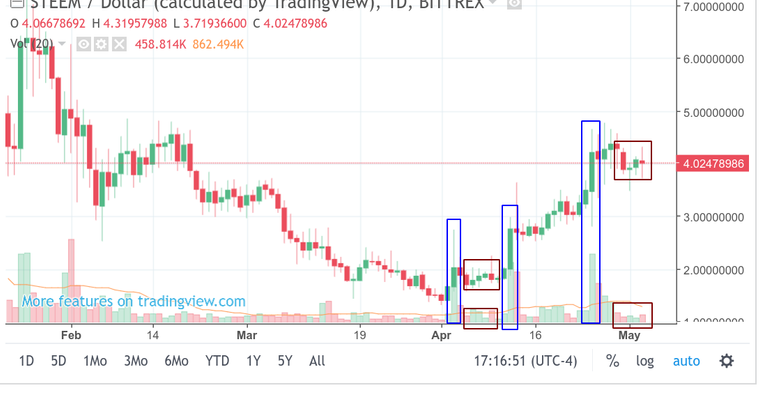
Yes, I like STEEM chart here. One of my favorite patterns is, when you have strong up move on big volume (blue rectangles) then consolidation on weak volume (brown rectangles). When you see this, there are great odds that next move is going to be up again.
Also if consolidation is going to be long enough, we get cup and handle pattern also. (since Feb 2018)

No guarantees though ;-) but odds are good...
That's a very healthy pattern you point out and one of the first to keep an eye on. One of the oldest TA classics!