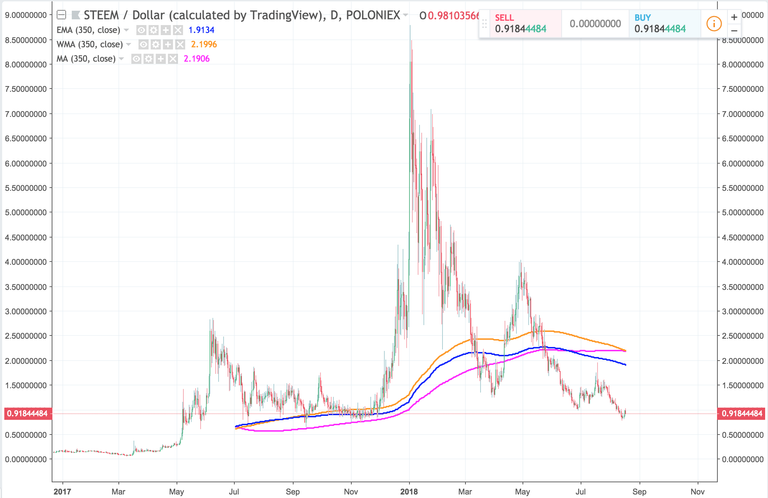
I like this STEEM chart with 3 differently measured averages a lot.
Check it out on TradingView:
https://www.tradingview.com/chart/SYpEbbiW/
I like this STEEM chart with 3 differently measured averages a lot.
Check it out on TradingView:
https://www.tradingview.com/chart/SYpEbbiW/
EMA crossed down, still pointing downtrend
and EW tells me one more leg down
Could you please give me more information about that? I am eager to learn about chart analysis.
I always like to use EMA, it shows you the trend, when it goes up means uptrend and when it goes down means downtrend. also WMA and MA doing the same work. in your chart except the pink one is showing no trend the other two are all showing downtrend still which means bearish.as for EW(elliot wave) I will post a chart on my steemit tomorrow... it's time to sleep in my time zone..see you
Thanks followed you looking forward to more of your work.
Your post was mentioned in the Steemit Hit Parade for newcomers in the following category:Congratulations @wesleybos!
I also upvoted your post to increase its reward
If you like my work to promote newcomers and give them more visibility on Steemit, consider to vote for my witness!
Congratulations @wesleybos! You have completed the following achievement on Steemit and have been rewarded with new badge(s) :
Click on the badge to view your Board of Honor.
If you no longer want to receive notifications, reply to this comment with the word
STOPTo support your work, I also upvoted your post!
Do not miss the last post from @steemitboard:
SteemitBoard and the Veterans on Steemit - The First Community Badge.