statistics calculator pro
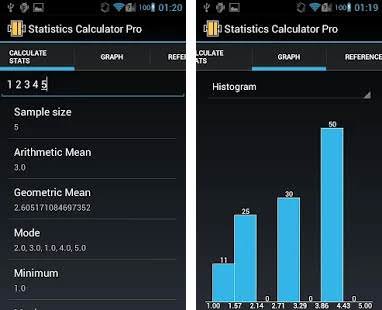
app calculate statistics and represent it on graphs
Screenshots

Hunter's comment
While you enter data, the app will calculate statistics and draw graphs corresponding to the data entered.
Available graphs:
- Bar chart
- Histogram
- Box Plot
- Line chart
Statistics:
- Sample size
- Arithmetic Mean
- Geometric Mean
- Mode
- Minimum
- Maximum
- Sum
- Median
- Variance
- Standard deviation
- Coefficient of variation
- 1st Quartile
- 3rd Quartile
- Quantile 1/8
- Quantile 7/8
- Quantile 1/16
- Quantile 15/16
- Quantile 1/32
- Quantile 31/32
- Outliers barrier
- Lower "Whisker"
- Upper "Whisker"
- Outliers candidates
The reference section of the application contains statistics formulas.
Link
https://m.apkpure.com/statistics-calculator-pro/com.cgollner.pro
Contributors
Makers and Contributors:Hunter: @siah
- @goodnewworld (20% beneficiary of this article)
- @gattino (20% beneficiary of this article)

This is posted on Steemhunt - A place where you can dig products and earn STEEM.
View on Steemhunt.com
OOps ! Your Steemhunt can't be verified.
Reason :
6. Post "New" Products
Steemhunt is about cool "new" products. Please make sure that your hunt is something recently introduced. If the product is not new, there must be a strong reason to post. For example, the product must be substantially updated or upgraded in a way that has a positive effect on users. Even though the set period of time to define whether it is newly launched is subjective, the moderators may ask if the product is widely considered to be a “new product” (or substantially updated).
Join us on SteemHunt's discord to chat with us.
https://discord.gg/3BG4r4q
Please refer guidelines for SteemHunt here
checkout @steemhunt for latest updates