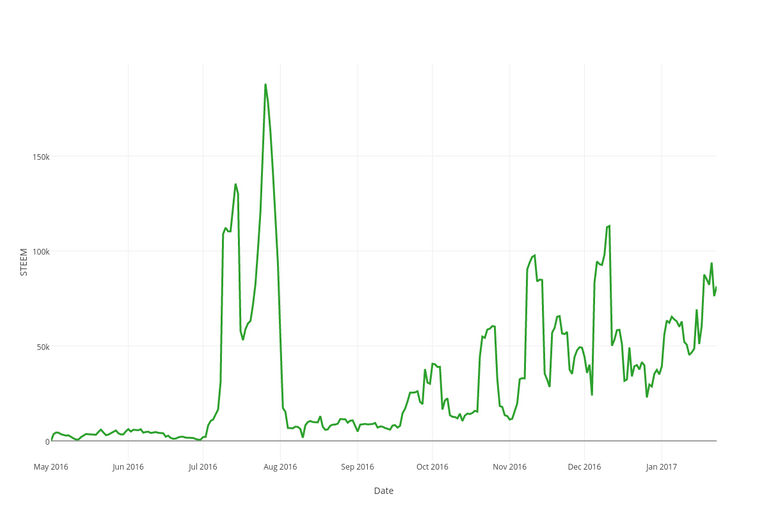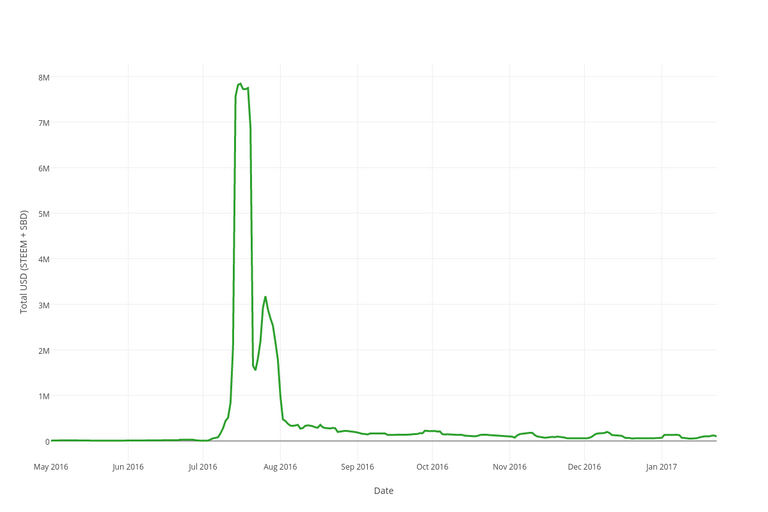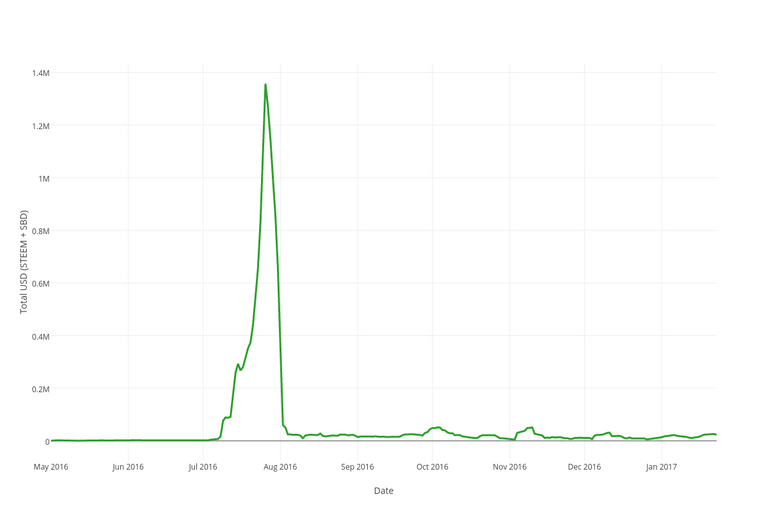
This report provides some insights into trends of aggregated token transfers between Steem accounts including and excluding major exchanges and outliers.
At this moment I'm not speculating on the meaning of this data but please do post your opinion or ideas in the comments.
About data
- All metrics are calculated using 7 day moving average
- The following exchange accounts are excluded: @poloniex, @bittrex, @openledger, @blocktrades, @livecoin
- The following outliers are excluded: @abit, @adm, @steemit, @steemit1
- Abit and adm generated a lot of transfers and are huge outliers. At this moment I don't know why.
- Total USD transfers are calculated by summing up SBD and STEEM multiplied by volume weighted average price
Disclaimer
The data and visualization in this post may contain errors and inaccuracies. Don't make important decisions without verifying data yourself. If you have any suggestions or found an error in the data, please get in touch with me on steemit.chat.


I don't know the whole story between @abit and @adm, but I recall that back when the network paid "liquidity rewards" to people who ran market-makers on the internal Steem currency exchange, @abit and his secondary account @adm essentially monopolized the liquidity rewards. I don't know if your transfer analysis includes market operations, but even if it doesn't, I'd imagine that he would have had to transfer money back and forth between his two accounts quite a lot to be able to balance them out.
My data doesn't include market operations, only
transferops and I've heard something about liquidity rewards monopolization but didn't know that it related to @abit and @adm. Thanks for this!If you added the transfers and posts, does that reflect all the transactions? Or are there others? That last graph highlights, for me, the challenge of getting enough transactions to test the scaling capacity of the underlying blockchain code. Thanks!