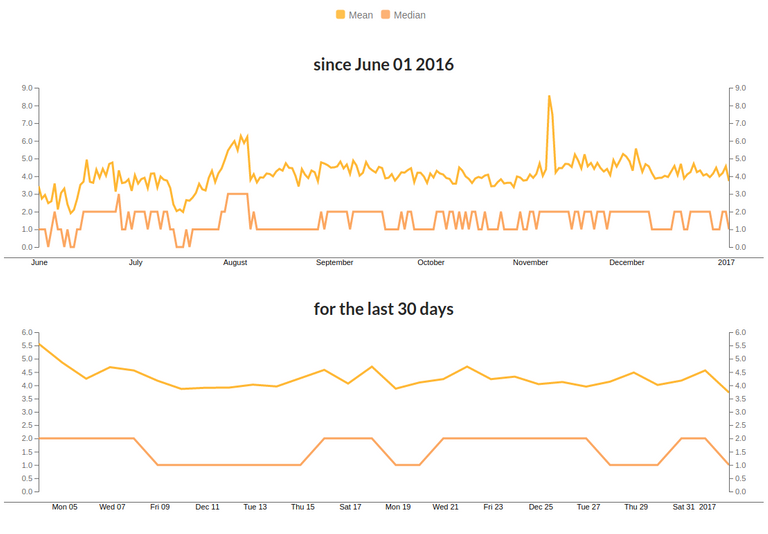
Key findings: mean is 4-5 comments per post, median is 1-2 comments per post and these metrics are mostly moving sideways.
Steempunks changelog
- New overview dashboard metrics
- New mean and median number of comments per post line charts
Mean and median chart

Available Tools
- Historical charts for multiple metrics
- 24h rolling ratings for posts, comments and authors
- Key metrics dashboard
Roadmap
This is 0.8 beta release. If you have any feedback, suggestions or need a feature, get in touch.
- More charts, tables and visualizations
- More ratings
- Realtime dashboards
- Personal analytics
- Bot management
My tech stack
- Postgres 9.6
- Postgrest
- React 15.5
- Rxjs 5
- create-react-app boilerplate
- Elixir and Erlang/OTP
- Docker
If you will need any help with docker, I will be very happy to help you :)
This post has been ranked within the top 25 most undervalued posts in the second half of Jan 03. We estimate that this post is undervalued by $12.94 as compared to a scenario in which every voter had an equal say.
See the full rankings and details in The Daily Tribune: Jan 03 - Part II. You can also read about some of our methodology, data analysis and technical details in our initial post.
If you are the author and would prefer not to receive these comments, simply reply "Stop" to this comment.
With my comment you're post is now at three times the median comments per post!
And now it's four times the median! :D
Do you have any statistics about the upvotes and earnings for comments? I seem to get well above the mean and median number of comments, and I make a lot of them, too.
Do you see much difference between a post's original payout (and other metrics) versus the 30-day performance? In looking at past posts for most people, I don't see any difference. But there are some posts, in the 30-day trending, that seem to do quite well after their initial payout. It would be helpful to understand better how a post can continue to perform after the initial payout.