If you're like me you already have a busy schedule. Now that Steemit has taken over your life, you struggle to find a balance between posting regularly and living a healthy lifestyle, away from your computer and among other social beings.
I might be exaggerating a bit. But here's what I know for a fact:
People on the platform want their posts to be upvoted, but they're not using the open data provided by the blockchain to their advantage.
Luckily, today, I'm here to bring some of that crucial information to you!
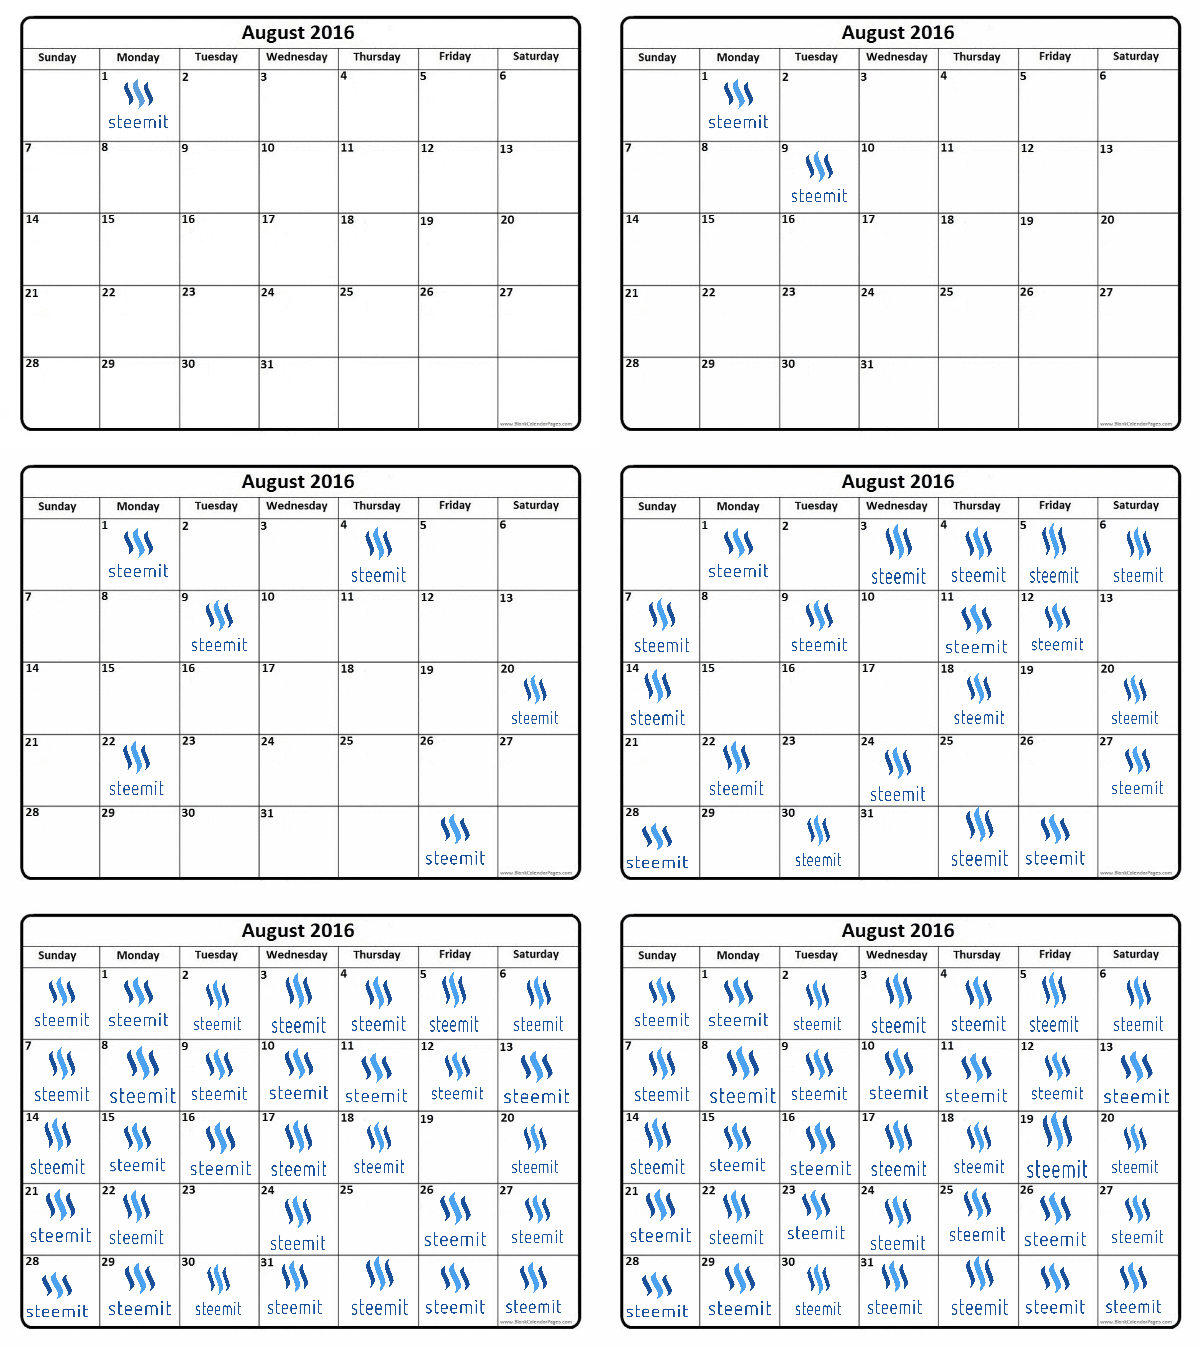
Typical user's August schedule
 ]
] If you want your schedule to look like the one above, I don't blame you. When it comes to optimizing your payouts, though, you may be doing it wrong. It seems fairly clear that users aren't always posting at ideal times, as pointed out in my previous blog69% of the total voting power platform.. Please refer to it to understand how I normalized the data here. For this post, I've gathered upvotes made from the top 50 users (ignoring @steemit) with the most Steem Power and looked at the time period in which each upvote was made. On their own, those 50 users account for close to
Putting it another way, they're responsible for 69% of the payouts given every day.
They're the ones you want to get upvoted by.
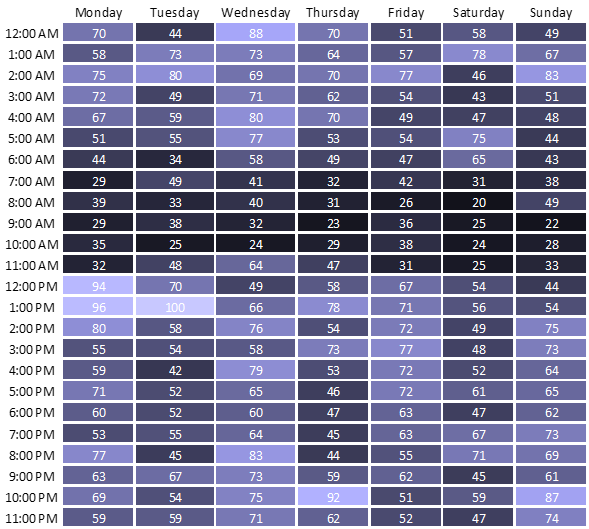
Normalized number of upvotes given by top 50 largest SP holders

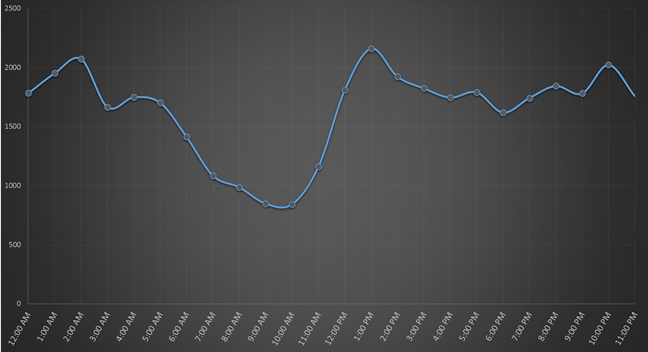
Since the beginning of Steemit, whales (top 50) have upvoted a total of 39258 blog posts/replies. In contrast, a total of 1 601 160 upvotes were given on the platform from all users combined at the time of writing this post. This tells us that our whales are quite active with ~785 upvotes/whale on average. It should be clear from the above that you should try avoiding to post between 6:00 AM and 11:30 AM UTC. The drop in upvote during these morning hours is significantly more pronounced than the drop in number of posts during that same time (source). This next plot shows more explicitly the whale upvoting cycle:
Total number of whale upvotes at different hours

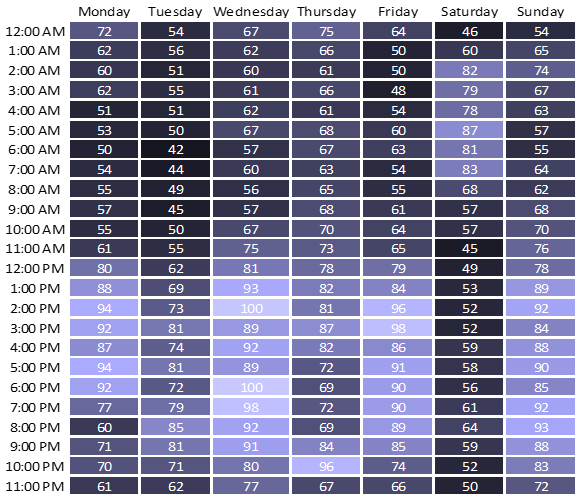
As a reference, I thought I'd also share the same table as the one above but for all users. We can still see a drop around the same hours as the one discussed above, but it's significantly less. Note that the color scale was modified to highlight differences within that table and don't represent the same values as the ones from the first table.
Normalized number of upvotes for all Steemit users

Hope you enjoyed this daily dose of Steemit data. Let me know what you'd like to see next and join me in understanding the numbers that make this site run.
Great info! Wow yeah very interesting!
that's some really great information. thank you @complexring bringing me here
Thanks, I appreciate it!
definitely following you
You deserve some credit for this one.
Nice chart, is there a way to chart out popularity of topics and timeline?
Hi @hutch, I'm not sure I understand the question. The information on the blockchain can allow you to filter posts by categories (like popular, hot, trending, new, etc.) and each post has the creation date you can filter for. Or are you talking about doing that directly on Steemit.com?.
Yes, how do you filter posts by categories on the blockchain?
I use piston, so I can get that information by calling steem.rpc.get_discussion_by_tag name(). If you already have a list of posts and want to filter them, you can use steem.rpc.get_content('idenfitier') and filter by 'tags' and 'created'.
Hope this makes sense, let me know if it's not clear enough.