Why the CPU utilization is near to 100% on my server machine? Why there is a steady decrease in the available memory? Why the calls are getting dropped? We often get these kinds of questions If we are from a performance upkeep team. And most of the times we do not know the answers of any of those questions. Fortunately, now, Microsoft has come for our rescue with Microsoft performance toolkit. Using this toolkit, you can answer which API / function of your server consumes high percentage of CPU time. You can answer which function is leaking memory, where the network is getting stuck. You can track almost all the OS resources like disk I/O, File I/O, Power usage, GPU activity, audio, video and many more. In this article we will see how to use the windows performance tool kit to do high CPU utilization analysis and memory leak analysis.
You can download the toolkit from here https://docs.microsoft.com/en-us/windows-hardware/get-started/adk-install
This is the official Microsoft docs link for windows performance toolkit https://docs.microsoft.com/en-us/windows-hardware/test/wpt/index
Installing windows performance toolkit for performance analysis:
Invoke adksetup.exe which can be downloaded from <a href="https://docs.microsoft.com/en-us/windows-hardware/get-started/adk-install" target="_blank" rel="nofollow noopener noreferrer">https://docs.microsoft.com/en-us/windows-hardware/get-started/adk-install</a>From the features list select only “Windows performance toolkit”, we do not need other tools for now.
Windows performance toolkit has two main components: Windows Performance Recorder (WPR) and Windows Performance analyzer(WPA). Windows performance recorder is used to record windows session. It can record all activities / events and resource consumption for the current session. The collected data is then stored in a file. Windows performance analyzer is used to analyze the data collected by WPR.
How to use Windows Performance Recorder:
- On the Start screen, click Windows Performance Recorder or from start menu search box execute command WPRUi. This will open the following window.
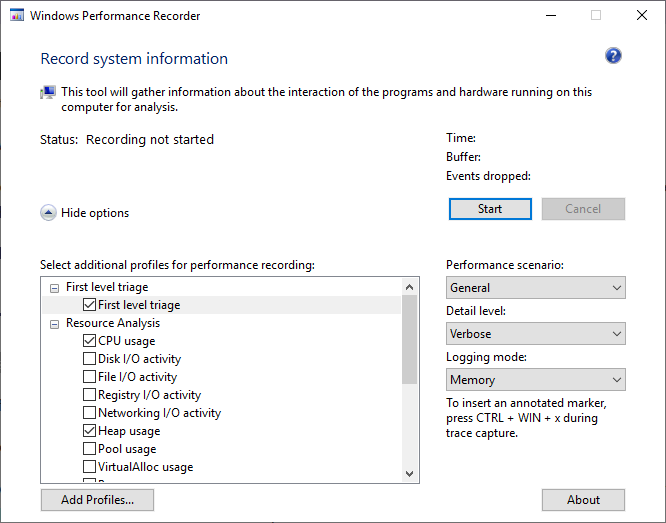
Windows performance recorder
- To gather CPU and memory related information, select “CPU usage”, “Heap usage” , and “VirtualAlloc usage” from the Resource Analysis options. Keep “First level triage” selected from First level triage section.
- Set Performance scenario: “General”, Detail level: “Verbose” and Logging mode: “File” as shown in the image below.
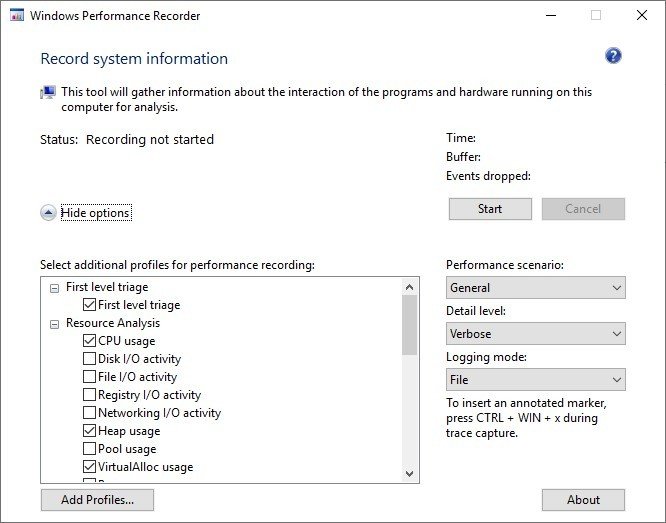
Windows performance recorder next step
- Stop other bulky applications such as web browsers etc which you do not need, otherwise, those applications will also be tracked by WPR.
- Now, click on “Start” button to start the recording.
- Then start your application server/exe for which you want to do performance and memory leak analysis.
- Click on the “Save” button to stop the recording. This will launch a new save file dialog. Save your recording to the location you want.
Sample program to evaluate windows performance toolkit:
You can use the following sample program to evaluate windows performance toolkit. Using this program you can do CPU usage analysis as well as memory leak analysis.
In the following program functions highCPU(), midCPU() and lowCPU() are CPU bound functions. The names given to these functions indicate the level of CPU usage. Function memoryLeak() leaks some memory allocated on heap. This function is used to demonstrate the memory leak analysis. First, start recording session using windows performance recorder (WPR) and then start executing the following program. Once the program finishes execution stop the recording and open the recorded file in windows performance analyzer.
// Poor_performance.cpp : This file contains the 'main' function. Program execution begins and ends there.
//
#include "pch.h"
#include <iostream>
#include<string>
#include<thread>
#include<vector>
using namespace std;
string highCPU()
{
std::string str = "";
int sum = 0;
for (long i = 0; i < 100; ++i)
for (long j = 0; j < 100; ++j)
for (long k = 0; k < 100; ++k)
for (long l = 0; l < 100; ++l)
for (long m = 0; m < 100; ++m)
{
sum ^= i ^ j ^ k ^ l ^ m;
}
return str;
}
string midCPU()
{
std::string str = "";
int sum = 0;
for (long i = 0; i < 100000; ++i)
{
sum = sum ^ i;
}
return str;
}
string lowCPU()
{
std::string str = "";
for (long i = 0; i < 10; ++i)
str += "l";
return str;
}
string memoryLeak()
{
char *c = new char[100000];
for (long i = 0; i < 10000; ++i)
c[i] = 'k';
string r(c);
return r;
}
int main()
{
std::vector<std::thread> threadVector;
for (int i = 0; i < 8 /* 8 CPU cores */; ++i)
{
std::cout << "High CPU! thread = " << i << "\n";
std::thread threadObj(highCPU);
threadVector.push_back(std::move(threadObj));
}
for (auto &it : threadVector)
{
if (it.joinable())
it.join();
}
cout << "Momory leak" << endl;
memoryLeak();
memoryLeak();
memoryLeak();
memoryLeak();
memoryLeak();
memoryLeak();
memoryLeak();
memoryLeak();
cout << "Mid / low CPU usage" << endl;
midCPU();
midCPU();
midCPU();
midCPU();
midCPU();
lowCPU();
lowCPU();
lowCPU();
lowCPU();
lowCPU();
lowCPU();
cout << "Momory leak" << endl;
memoryLeak();
memoryLeak();
memoryLeak();
memoryLeak();
memoryLeak();
memoryLeak();
memoryLeak();
memoryLeak();
}
How to use Windows Performance Analyzer:
Windows Performance Analyzer (WPA) is a tool that creates graphs and data tables of Event Tracing for Windows (ETW) events that are recorded by Windows Performance Recorder (WPR), Xperf, or an assessment that is run in the Assessment Platform. WPA can open any event trace log (ETL) file for analysis.
Double click on the .etl file generated by WPR, it will open that file in WPA. In the WPA on the left-hand side you can see a graph explorer window. By default, you can see an empty analysis view is opened. If not, then go to top menu bar Windows->New Analysis View to open analysis view.
The first thing you should do before starting any analysis is that you should configure symbol paths for your exe / server. To do that click on Trace->Configure Symbol Paths. In the opened dialog box add path to the .pdb files of your application.
Now, expand the Computation graph in the Graph Explorer; you will see CPU Usage (Sampled) graph under it. Drag the CPU Usage (Sampled) graph to the Analysis view panel.
On the Analysis tab, you can select a time interval by dragging the pointer horizontally across a section of the graph. The timeline at the bottom of the tab applies to all graphs on the tab.
After you have selected a time interval, you can zoom in to expand that time interval to the full width of the Analysis tab. To do this, right-click the interval, and then select Zoom to selected time range. You can repeat this step several times to see very fine detail of a very small time interval.
All graphs on the Analysis tab use the same timeline. Therefore, this action expands the same time interval for all those graphs.
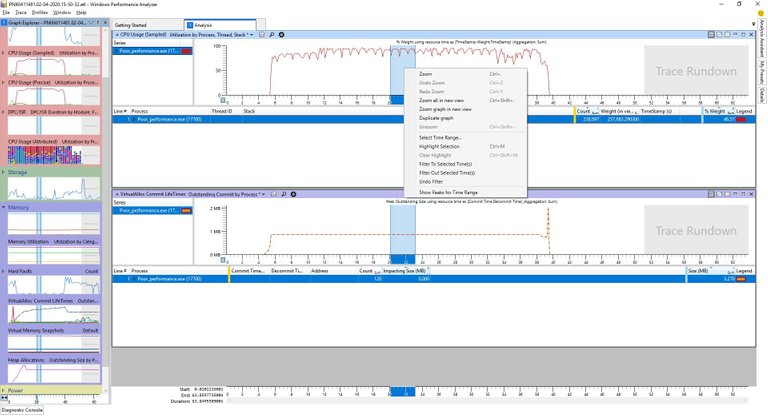
Windows apps performance graph
In our case, for the poorperformance.exe file, If you zoomed in you will see that the highCPU() was the main culprit for high CPU usage. Please see the image below, the highlighted sky blue color shows the overlap between CPU utilization graph and the time period for which the highCPU() was in execution. This is how you can find out the functions which are responsible for the high CPU usage.
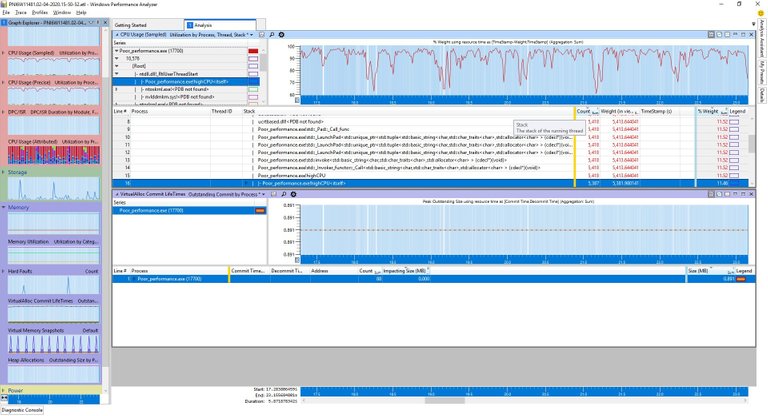
Windows apps performance graph next
Now, we will do memory utilization analysis and try to find out if there are any memory leaks or any unusual memory consumption patterns. For memory analysis, expand “Memory” graph in the graph explorer and drag “VirtualAlloc Commit Life Times” graph to the Analysis panel. In our case you will find that there is a spike in the memory utilization at the tail end of the memory graph. To find out the reason behind that uncommon memory peak, we select only that part of the graph and then do zoom-in as shown in the image below.
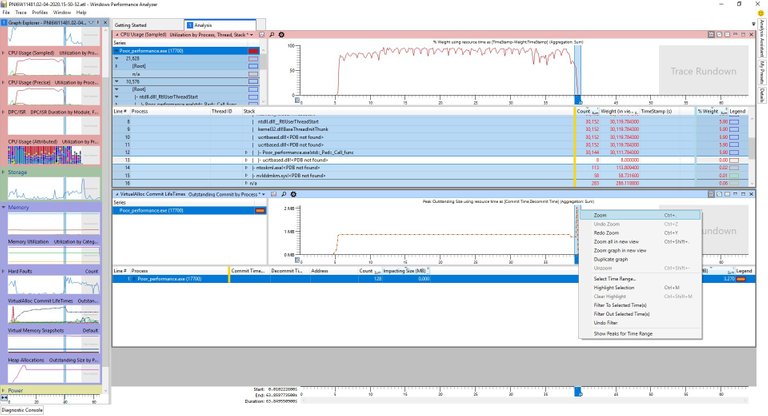
Windows apps performance graph final step
In the zoomed graph you can see that the spike in the memory consumption is due to memoryLeak() function. And, as the memory is not getting released even after the function finishes its execution it shows that there are memory leaks in the memoryLeak(). This is how one can do the memory analysis.
Conclusion:
The Winodows performance toolkit (WPR and WPA) can take you to the point where the problem lies. It does not give you the exact line number of your code, however, it gives you enough information to start the further analysis. We can use this tool to analyze anything and everything which can be called as a resource in OS’s world such as network, disk, memory, CPU, and power etc.
Posted from my blog with SteemPress : https://www.golibrary.co/application-performance-analysis-using-windows-toolkit/
Congratulations @golibrary! You have completed the following achievement on the Steem blockchain and have been rewarded with new badge(s) :
You can view your badges on your Steem Board and compare to others on the Steem Ranking
If you no longer want to receive notifications, reply to this comment with the word
STOPTo support your work, I also upvoted your post!
Do not miss the last post from @steemitboard:
Vote for @Steemitboard as a witness to get one more award and increased upvotes!