Hey everyone!
How are things? I really hope each and everyone of you are having a great time! I'm doing great, having time of my life while hiding away from civilization in the mountains. I'm on holidays, however business always comes first as far as I'm concerned. I'm a workaholic. Even though it's been a couple of relaxing days, I still feel exhausted. Seems like living in a big hectic city takes its toll on me! So I thought I would try something refreshing and blog about Cartography once again! No time to play around though, so let's get this started!
As promised in my previous Cartography post regarding conformal projections, this is the fifth part regarding the scientific field of creating accurate 2D depictions of our 3D world. This time I'm taking the chance to share some general technical information concerning equal-area projections, which is one of the main categories of cartographic projections utilized nowadays as mentioned before. We will also discuss broad information about the four types of equal-area projections that are mainly used nowadays, so bare with me!
As the title reads, these are still introductory posts! But what does that mean? Well, it basically means that we will be discussing broad introductory information in a humoristic manner in order to keep things as simple as possible and less boring than in reality. Kidding. There's a 100% chance of learning a thing or two by staying focused and reading through this blog, so give it a try!
Image Source: pixabay.com
As stated before in a previous Cartography blog of mine regarding cartographic transformations, spatial distortion is inevitably included in all 2D depictions of a 3D object. As a result, errors concerning spatial distribution give birth to various sorts of distortion according to the formulas utilized by a projection and the mathematical patterns followed. In order to achieve a deeper understanding of the concept of spatial distortion, we will discuss technical information concerning the various sorts of equal-area projections and the differences and similarities between the geographical attributes utilized by each projection.
Equal-Area Projections
Equivalence is the most significant attribute taken into consideration when deciding which specific projection should be utilized in the development of small scale maps that serve general purposes, as well as the design and construction of maps that are mainly used for educational purposes. The precise depiction of the true size of the area of surfaces through the use of graphical elements and mathematical formulas is essential in such cases. However, due to the fact that the natural terrestrial surface can be projected within the boundaries set by any sort of flat surface, there are many different equal-area projection models that are broadly used on a global scale nowadays.
In cases of global projections, the spatial distribution of distortion is one of the most important elements and it is therefore meticulously calculated. However, due to the fact that most general reference maps utilize non equal-area projections, the are common misconceptions regarding the relative size of geographic entities. For instance Mexico and Greenland are actually equally sized while many believe that Greenland's surface area is much larger. Furthermore, it is another common misconception that North America has a larger surface area than Africa, when in reality Africa's surface area is larger by approximately six million square kilometers (6 x 10^6 km^2). Such misconceptions are the product of the selection of projections that are considered inappropriate, taking into consideration the purpose of general reference maps used for educational purposes.
It is worth noting at this point that the significant attribute of equivalence represents a lot more than just a passive factor that can be easily manipulated. Let's always keep in mind that various categories of symbols that are broadly used by Cartographers depend on the attribute of equivalence in order to efficiently depict the relative density of continuous phenomena. It is safe to say that the need for the utilization of an equal-area projection is greater when projecting large areas of the natural terrestrial surface. Obviously, there are multiple ways to preserve the significant geometric attribute of equivalence while projecting the reference sphere on a 2D surface. Therefore, most known projections nowadays are equal-area projections that are divided into four main categories, as demonstrated below. It is worth keeping in mind that the proper selection of an equal-area projection depends on the size of the part of the natural terrestrial surface projected and the distribution of angular distortion.
Albers Projection
Cylindrical Equal-Area Projection
Sinusoidal Projection
Mollweide Projection
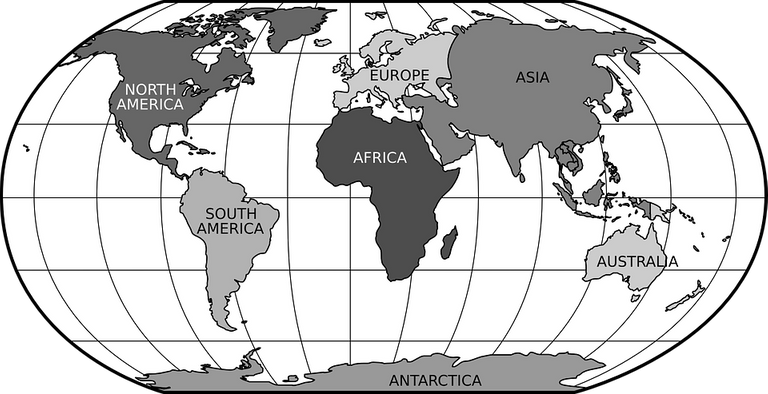
Global Map - Robinson Projection./ Image Source: pixabay.com
Albers Projection
The Albers Projection is broadly used by Cartographers and Engineers in general nowadays. This is an equal-area conic projection that utilizes two primary parallels. Due to the nature of the geometry used in the development of this projection, the zones of distribution of spatial distortion are parallel to the primary lines of the projection. As a result, this conical projection includes relatively low distortion values regarding spatial distribution. Meridians in the Albers Projection are depicted as converging straight lines while Parallels are depicted as concentric arcs that intersect Meridians forming 90 degree angles, therefore this specific projection resembles the reference sphere's grid when designed meticulously. Thus, the Albers Projection is a suitable option for areas situated closer to the Equator.
The scale factor in the Albers Projection changes gradually along the Meridians in all areas of the projection apart from the projection's primary lines. This basically means that the value of the scale factor equals less than 1,0 along the Meridians while its value in areas situated between the boundaries set by the primary lines equals slightly more than 1,0. It is worth noting at this point that the Parallels' curvature is unacceptable in cases where the projection expands for more than 100 degrees of length on the reference sphere's surface. It is therefore obvious that this is a rather useful projection for the precise depiction of geographic distribution. As a result, it is broadly used by government agencies around the world.
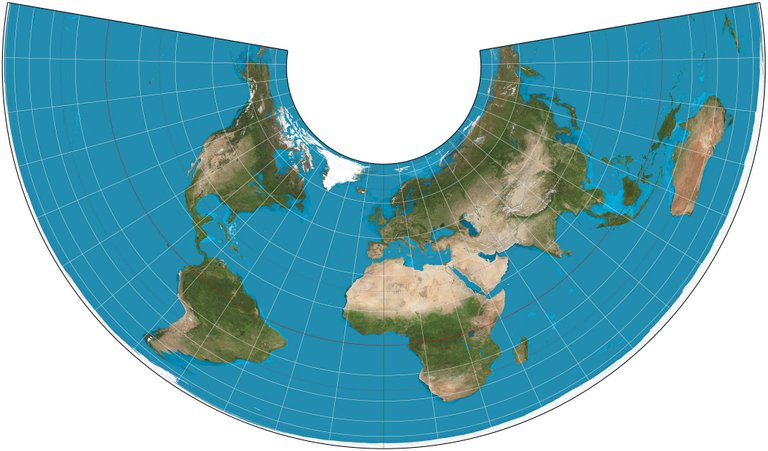
The Albers Projection./ Image Source: en.wikipedia.org
Cylindrical Equal-Area Projection
The Cylindrical equal-area Projection is another rather significant projection that is frequently utilized by Cartographers and Engineers in general nowadays. This specific projection's design and construction is achieved by utilizing two primary Parallels, which in several cases might coincide and therefore create a maximum circle which happens to be the Equator. However, there are also cases in which the primary lines are any possible pair of Parallels with a latitude of the exact same absolute value. Inevitably those primary parallels utilized by the Cylidrical equal-area Projection are situated in different hemispheres of the reference sphere and therefore this specific version of this cartographic projection is rather useful, as it stretches distances East to West at a constant rate regardless of latitude.
Even though the Cylindrical equal-area Projection represents the natural terrestrial surface in a rather unusual way, it certainly includes the smallest amounts of angular distortion than any other equal-area projection used nowdays, especially in cases where the primary parallels are situated at a distance of less than 30 degrees from the Equator. The ratio of the vertical to horizontal axis plays a rather significant role as it basically determines the Parallel at which there is no spatial distortion. Furthermore, the ratio of the vertical to horizontal axis specifies the Parallel along which distances match the average scale. Those two standard parallels are the main characteristic of the Cylindrical equal-area Projection. To conclude, it is safe to say that this particular projection represents the natural terrestrial surface depicted on a stretched vertical cylinder.
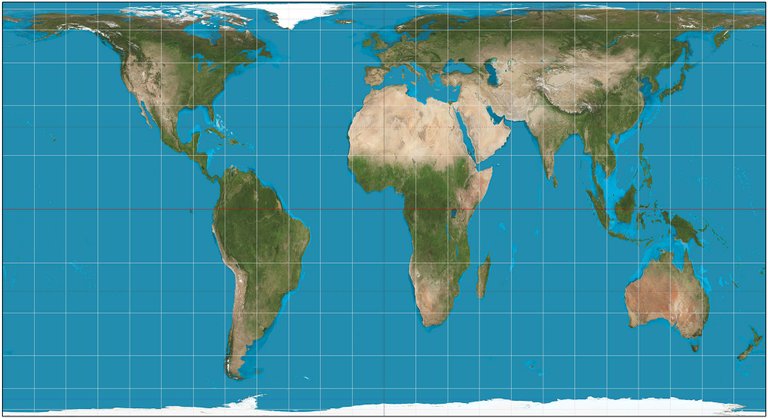
The Cylindrical Equal-Area Projection./ Image Source: en.wikipedia.org
Sinusoidal Projection
The Sinusoidal Projection is a pseudocylindrical projection which is also known as the Mercator equal-area Projection. This specific cartographic projection is conventionally oriented, which is basically achieved by utilizing a primary Meridian that is depicted as a straight line, and a primary Parallel which happens to be the Equator. It is worth noting at this point that there is no angular distortion included along the direction of those two primary lines. Let's also keep in mind that spatial distortion is the smallest possible in areas of the projection that are situated close to those lines. Due to the nature of the Geometry utilized in the design of the Sinusoidal Projection, it is possible to measure the true distance between two points on a Meridian as the vertical distance between the parallels intersecting at those specific points.
All Parallels depicted in the Sinusoidal Projection are considered as basic reference Parallels, therefore the distance between Parallels demonstrated on the projection is always constant. This provides the observer with an illusion regarding the actual real-world distances, which is a rather useful attribute of the Sinusoidal Projection in cases when correlations between geographic entities of different latitude are specific in particular. The Sinusoidal Projection is the appropriate option for Cartographers, concerning the design and construction of mappings that depict relatively smaller areas. It is worth noting at this point that the distribution of spatial distortion in areas situated close to the Equator is rather satisfying.
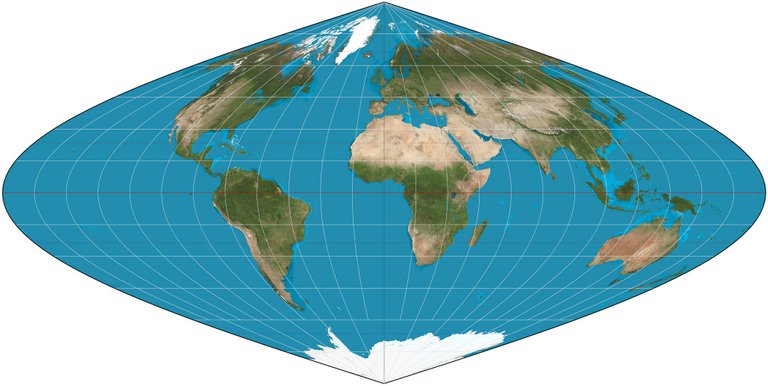
The Sinusoidal Projection./ Image Source: en.wikipedia.org
Mollweide Projection
The Mollweide Projection is another pseudocylindrical projection which is boradly used in the design and construction of global maps nowadays. This projection depicts the natural terrestrial surface in a more realistic manner than the Sinusoidal Projection mainly due to the fact that it represents the shapes of geographic entities located in areas close to the poles more accurately, which is mainly caused by the projection's relatively normalized shape. A slight reduction regarding the scale factor values in the direction of the north pole, in areas of latitude of 20 degrees or less, as well as a slight increase in scale factor values in the same direction in all areas are essential in order to develop the significant attribute of equivalence.
The exact opposite rule is applied in the direction of the East. The scale factor values in the direction of the East is increased in areas of longtitude of 40 degrees or more, while the scale factor values in the same direction in all other areas are reduced proportionally. Inevitably the shapes og geographic entities depicted are affected and, therefore, changed accordingly. The areas of minimum spatial and angular distortion make this specific projection suitable for global mappings, especially when the areas of interest are situated at a maximum distance of 40 degrees of latitude. It is worth mentioning at this point that many projections are considered as hybrid projections, which basically means that they were designed and built by using attributes of 2 or more different projections, in an attempt by Cartographers to create useful tools of spatial distribution. The Mollweide Projection's geometric attributes have been utilized in the creation of a few cartographic projections.
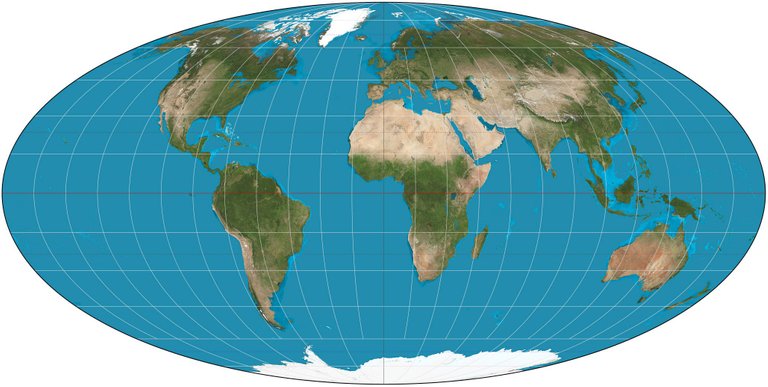
The Mollweide Projection./ Image Source: en.wikipedia.org
Alright folks, that's it for today. That brings us to the end of this introductory Cartography post regarding the category of Equal-Area Projections. As promised before, there will be more Cartography posts in the near future as we need to discuss each broad category of projections meticulously. Cartographic Projections are a vital part of the art of creating accurate 2D depictions of our 3D world, thus we will talk about all main categories one by one. If there are any questions, feel free to let me know in the comments below and I will provide detailed answers. Hope you enjoyed this post! Follow me for more Engineering blogs! :)

IMAGE SOURCES:
REFERENCES:
University Textbooks & Course Lectures:
Χαρτογραφία Ι / Cartography I - TSOULOS LYSSANDROS(National Technical University of Athens,School of Rural & Surveying Engineering,Course Lectures)
Xαρτογραφία ΙΙ / Cartography II - NAKOS BYRON(National Technical University of Athens,School of Rural & Surveying Engineering,Course Lectures)
Στοιχεία Χαρτογραφίας,Πανεπιστημιακές Εκδόσεις Ε.Μ.Π. / Εlements of Cartography, University Publications NTUA - ROBINSON, MORRISON, GUPTILL, KIMERLING, MUEHRCKE(National Technical University of Athens,School of Rural and Surveying Engineering,University Textbook)
Internet Links:
https://www.caliper.com/glossary/what-is-an-equal-area-projection.htm
https://gisgeography.com/conic-projection-lambert-albers-polyconic
http://www.progonos.com/furuti/MapProj/Normal/ProjCyl/ProjCEA/projCEA.html


Thank you for your attention!
Hope you enjoyed this post and did learn a thing or two.
Follow me and stay tuned for more engineering blogs.
Highest Regards
@lordneroo
Your post has been selected by Connect to the World FR
@cw-fr
We promote English posts in the French community!!https://steemitimages.com/0x0/https://gateway.ipfs.io/ipfs/QmYzPJNVRmfzfeMQKLKCtxSVxuw5KLbmKv3snEh2DJGPjg
By selecting 4 posts every 3 days that we recommend to read to the French community!!
Thanks for the great content!!
Whoa! I'm honored!
Thank you so much for the support, guys! Means a lot to me! I put hard work into my blogs so it feels great to see my efforts rewarded.
Stay awesome and thank you for including my work in your post!
Good work @lordneroo . The Hammer-Atif projection is the one I'm (or was) most familiar with and is similar to the Mollweide projection.
Hey @terrylovejoy, thank you for the support! It's always good to see you around, thanks for dropping by my blog. The Hammer Projection is an equal-area projection that utilizes the same elliptical shape as the Mollweide Projection which is why the are so similar to each other.
The Hammer-Aitoff is an equal-area projection as well, however it stems from the Lambert Azimuthal equal-area Projection by modifying some of its geometric properties. It does bare resemblance to the Mollweide Projection in certain cases for sure though!
Stay awesome!
Cartography. This is cool.
How do you get aids in doing the geomapping ?
Do you use already laid out figures or you dource for then with a team.
This feels very tedious 😨
Hey there, thanks for reading and leaving the comment.
There are multiple ways to create mappings, from utilizing observations acquired with the use of advanced instruments and statistically analyzing them to create a model, to using satellite images or aerophotography, or even digitizing already existing maps and creating new layers which then have to be georeferenced by applying certain topographic techniques.
Thanks for dropping by ;)
Always 👍👍👍
Very exciting, I would also like to deal more with geography. A follow is guaranteed.
Thanks for dropping by and reading! I will probably blog about Geography as well in the future!
I've notice in some maps Africa was much smaller than it should be. I always wondered why or how they came to that conclusion but thanks for sharing these ways of how it is mapped out.
Do you do lots of work in the field of cartography?
Hey @humanearl, thanks for dropping by and supporting my work!
This reduction in size is also known as spatial distortion and is caused by the cartographic projection utilized in order to depict a 3D object on a 2D surface. The reference parallel is situated North of Africa in most global map projections, thus the shape of Africa is gradually distorted as we move away from the Equator towards the South. The map scale makes sure all measurements are precise; it's just that the scale changes according to location.
Cartography is one of the scientific fields I've studied in order to get my Rural & Surveying Engineering Master's Degree.
Thank you!
Χρόνια Πολλά,Χριστός Ανέστη
Πραγματικά παρά πολύ ωραίο ποστ..
Ελπίζω να πέρασες όμορφα σήμερα..
Ευχαριστώ πολύ! Χρόνια πολλά με υγεία στην οικογένεια εύχομαι! Να χαίρεσαι το παιδάκι σου κι ευχαριστώ για τα καλά σου λόγια!
Ευχαριστώ πολύ.. κι εσυ προ πάντων υγεία και οτι επιθυμείς..😀
Hey. Thank you for sharing - found it valuable. Resteemed and hoping we will get this trending. Thank you for posting.
Thanks for dropping by and resteeming!
thanks for sharing the different projection about the globe with us ! I wasn't aware that there are so many different approaches ..Hey @lordneroo
Hope you are enjoying your Sunday! :)
Hey @crypto2go, thank you so much for reading! Cartographic Projections are divided into categories regarding their attributes and Geometry.
I'm doing great!
Hope you're having a great time as well!
Thank you for your contribution and for putting references/sources!
=======================================================================================
This post was upvoted by Steemgridcoin with the aim of promoting discussions surrounding Gridcoin and science.
This service is free. You can learn more on how to help here.
Have a nice day. :)
Thanks for the support, guys! Keep up the good work!
thank you so much
You're very welcome!
Thanks a lot for you to reply to my comments
No problem sir. :)
okay, thank you
I'd like to listen to the audio version of my profile picture :P Kidding, thank you for your efforts. :)