Let's recap...
Before we look further into the city feral pigeon problem, let's revise what we've established so far with the Leslie model for population growth.

Figure 1.
Feral pigeons in Catalunya Square, Barcelona.
Image Source: Wikimedia Commons
The general definition for Leslie model is shown below...
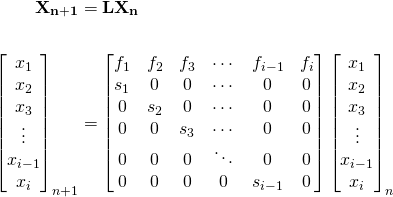
Here are some salient observations:
 . These are the average number of new borns for every member of age class i. This is technically known as fecundity, a biological term which describes the reproductive rate of an organism.
 . Each of these terms represents the fraction of the i-th age class that survive, and progress to the next age class. For instance, at the end of a cycle the number of survivors of age class 1 is
  , and these survivors are now the population of age class 2.
Alright, back to our infamous pigeon problem...
Finding the pigeon population Growth Rate: Eigenvalues
The city's authorities are concerned about the growing number of feral pigeons in popular public places where they have no natural predators, and pose a health risk to the community.
They want to know about the population growth rate, and based on this information, decide if they should embark on a pigeon population control program.
We found through many iterations, that the stable growth rate for the population is about 28.5% per year! But it took us quite a bit of work in performing powers of matrices and matrix multiplication to get there.
Well, us mathematicians have always been a lazy bunch. If there's a way to get the same result for less work, we'll find it. So let's do that.
Let λ represent the stable growth factor. We know that after a long time, the population at the end of a birth/survival/death cycle is a multiple of λ of the population at the beginning of a cycle, Xn. Thus...

But since Xn+1 = LXn, we have the classic eigenvalue problem...

For equation (1) to hold true, the determinant of the matrix  must equal 0. That is...
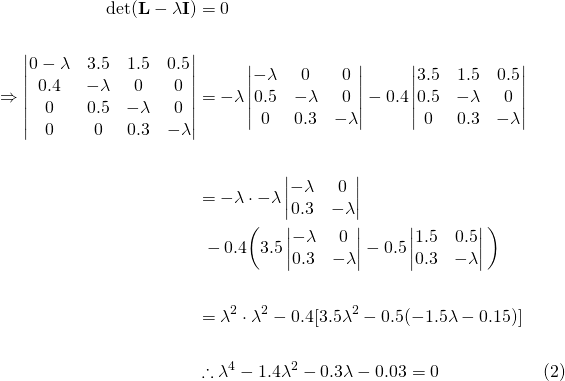
Equation (2) is known as the "characteristic equation". The roots of equation (2), and thus the eigenvalues of the Leslie matrix are...

The dominant eigenvalue (the larger in magnitude) of the two is  , which confirms our measured growth rate of 28.5%!
Note: for Leslie matrices, the characteristic equation will only have 1 positive root, which is the dominant eigenvalue.
Send in the Pigeon Busters!
After hearing this, the city's authorities are shocked at how quickly the feral pigeons are proliferating and consult you on an effective population control strategy.
They don't want to completely exterminate the pigeons because there are positive aspects to their presence in the city. They are a tourist attraction, they bring "life" to the city atmosphere, and they are entertaining to watch.
You suggest culling a certain percentage so that after a few years, there is no net population increase year on year. This means after n cycles, you want the population at the end of the next cycle to be the same as the current cycle, or...

Let's introduce a factor c which denotes the fraction of the population to be culled at the end of each cycle (a culling factor). Then on the other side of the coin, the fraction that is not culled, denoted by h...

Now we need to introduce h to our Leslie model such that the stable growth rate is reduced in order to achieve constant population over the years. That is...

Satisfying the condition of equation (3), no population change, we substitute the expression for Xn+1 in equation (4) into (3)...
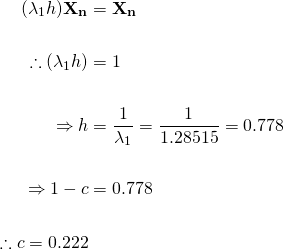
So, from our calculations, 22.2% of the entire pigeon population needs to be culled every year in order to maintain a stable population in the city going forward.
We can revise the original Leslie Matrix by multiplying it by h, which means we are effectively lowering the birth and survival rates as a result of our culling program.
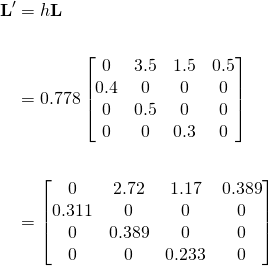
Let's call L' the "culling matrix".
We can predict the population over time the same way with the culling matrix as we did with the original Leslie matrix from the previous post. Iterating over 50 years (cycles) produces the results in Figure 2 below...
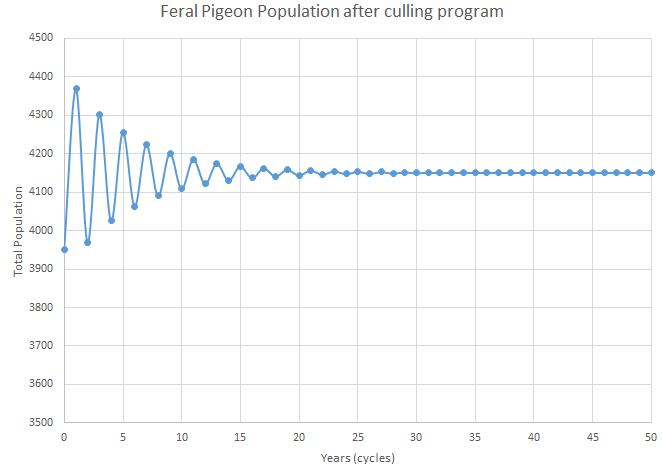
Figure 2. Projected population of feral pigeons with culling after each cycle
Figure 2 shows population stabilises to about 4150 pigeons as the permanent population in this city.
So given the culling percentage, how many should we kill at the end of each cycle?
Now, the actual birth rates and survival rates don't change, so in a realistic sense, the pigeons will still proliferate according to the original matrix L.
From the previous post, after 1 birth/death cycle, the expected population without any intervention is...

And thus the total population is 5615. Now, using the culling matrix, the expected population after the first cycle as a result of our intervention is...
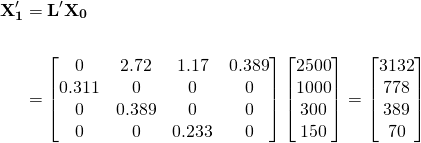
The difference between population vectors X1 and X'1 will give us the exact numbers to be culled.

So adding up the number culled from each age class, the total number we need cull after first cycle is 1246. To confirm, this is: 1246/5615 = 22.2% of the population.
Now, using the original birth and survival rates, the population expected at the end of the next cycle is...
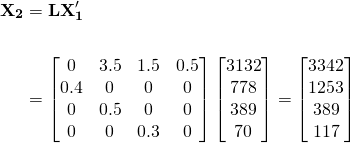
...which is a total of 5101. The expected population after this cycle using the culling matrix is...
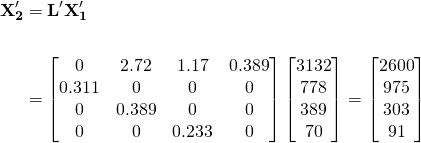
And the difference between the population vectors is...

So the total to be culled in this round is 1132, and again 1132/5101 is 22.2%.
Repeating the above calculations several times, we can plot the number required to be culled for each cycle in Figure 3 below...
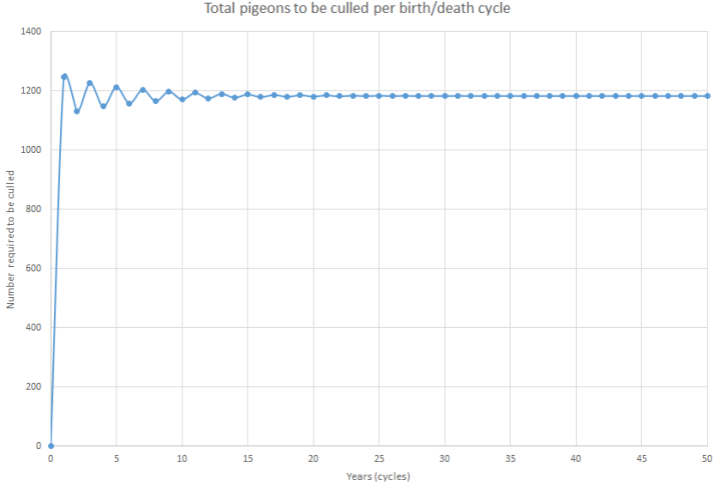
Figure 3. Number required to be culled for each cycle
We can see that eventually, the number required to be culled stabilises to 1184.
But it's too much!...
After a brief review, the city's authorities object that the number to cull is too high and they are concerned about the resources and costs required to implement the suggested culling program.
Is it possible to achieve the same stabilisation in the population with a fraction of the ~1200 we have suggested?
Well, you could argue that yes, it is! Because we have considered here is culling of the entire population. But it's only females that have the ability to reproduce.
The males, whilst involved in mating, don't lay the eggs. Since they're not adding to the population, they should eventually reach a stable number on their own without any intervention.
For our purposes, let's assume that the pigeon population is equally distributed between males and females. Therefore you tell the city's authorities that only about 600 female pigeons are required to be killed every year in order to maintain a stable population.
They decide to review the proposal again. How will they object this time? We'll find out in my next post... :)
Leslie Matrices
- Rise of the Feral Pigeons: Introduction to Leslie Matrices
- Fightback against the Pigeon onslaught: Culling and Leslie Matrices
Credits:
All equations in this tutorial were created with QuickLatex
All graphs were created with Microsoft Excel 2016
Please give me an Upvote and Resteem if you have found this tutorial helpful.
Please ask me a maths question by commenting below and I will try to help you in future videos.
I would really appreciate any small donation which will help me to help more math students of the world.
Tip me some DogeCoin: A4f3URZSWDoJCkWhVttbR3RjGHRSuLpaP3
Tip me at PayPal: https://paypal.me/MasterWu
Being A SteemStem Member
Wow...really excellent photo. Thanks for share.
You got a 1.32% upvote from @postpromoter courtesy of @masterwu!
Want to promote your posts too? Check out the Steem Bot Tracker websitevote for @yabapmatt for witness! for more info. If you would like to support the development of @postpromoter and the bot tracker please
wow
thanks for info
good luck