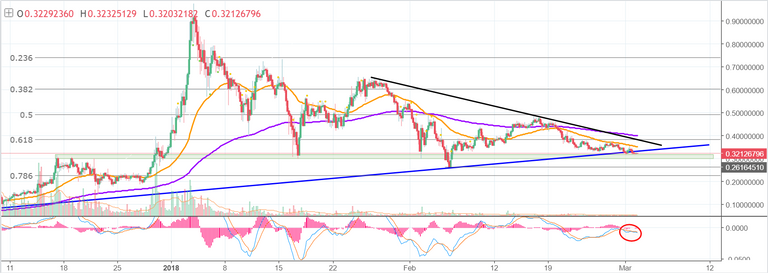
Hi friends! Welcome to this long overdue, highly requested update analysis on Stellar! Let's get it! Looking at the four hour chart, you can see that XLM has broken below the rising blue trendline support, and it's now moving into another level of support, indicated by the green horizontal box. Additionally, you can see that there is a weak bearish crossover on the MACD , and the volume is practically nonexistent. The volume is so low, you can barely even see it. It's probably as low as Britney Spears' hair when she shaved it, or the grass on a putting green. Anyway, it's clear that nobody is touching this thing. However, it's also clear that XLM remains in an overall downtrend, as it continues to print lower highs and lower lows.
From here, it's pretty clear that the forward path is going to depend on the price action around the green box support level . Since XLM appears to be in a sustained downtrend, the bias is to the downside, but the green support level has been very supportive since the all time high. Therefore, we need to watch to see if it's breached. If XLM breaks below the green support level , the next stop will be a test of the low on 2/6. A break back above the blue rising trendline would be a positive sign, but there is a lot of falling resistance overhead. You can see that the 50 EMA (in orange) the black trendline , the 61.8% retrace, and the 200 EMA (in purple) are there to put any rallies in check. Therefore, the technical bias remains to the downside

I was interested in Stellar for a while, but luckily I stayed away from it. Maybe if it goes down further it might be good value?