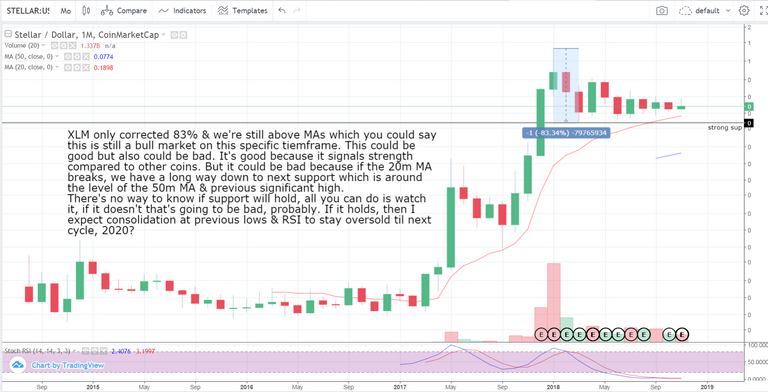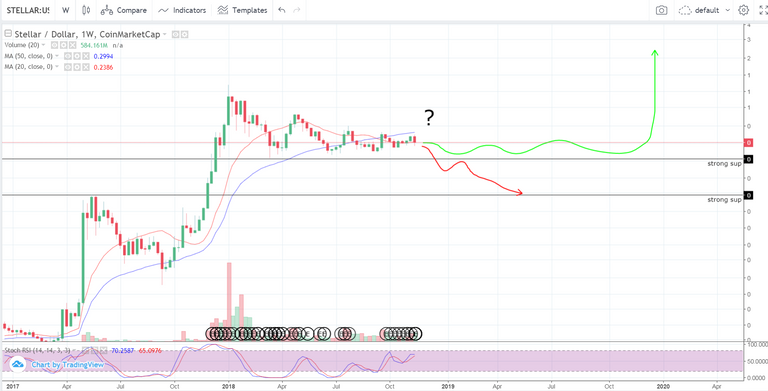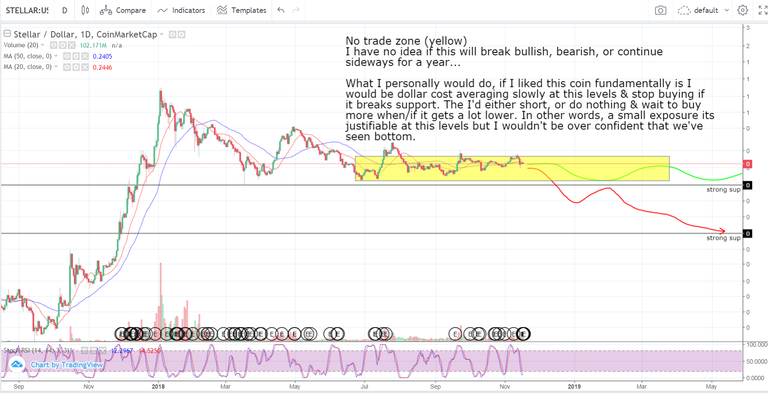
Hi guys, in this post I run technical analysis on Stellar XLM vs USD over the big timeframes, from 1 month to 1 day. In smaller timeframes than one day, this specific chart is totally flat, there's no trend, patterns or indicators that give any useful data to predict short term movements. This is a technical analysis chart requested by premium members & I will be doing it in image format instead of video since there's not that much to cover for a full video but it's too long to put it on telegram in a single image.
1 MONTH CANDLES:

1 WEEK CANDLES:

1 DAY CANDLES:

Subscribe to new video notifications: [email-subscribers namefield="NO" desc="" group="Test"]
Posted from my blog with SteemPress : https://dobe4ever.com/stellar-xlm-usd-17-nov-2018-members-requests/