US stock markets are set up for a similar situation as in 2015. A warning flag is flying.
Based on how 2015 markets performed, the correction in 2018 stock prices is likely to continue for some time.
The current bounce back may be what is commonly referred to as a dead cat bounce.
The warning flag to watch is the performance of junk bonds (all bonds below BBB credit rating are considered junk and have a higher probability of default)
Junk bonds (also known as high-yield bonds) have the highest interest rates due to the fact that these companies have weak balance sheets.
Bond investors can expected lower bond prices as interest rates rise either because the companies financial standing is deteriorating or if interest rates in general are rising due to supply and demand, economic environment or inflation concerns.
Companies want to borrow at the lowest rates possible to achieve their internal rates of return on their capital investments. Therefore if high yield rates are increasing faster than the overall interest rate environment it is a warning sign that something is not right with these companies.
A feed back loop can begin as rates rise, financial weak companies will begin to default, bondholders will lose capital and new investors will be reluctant to buy in fear of weaker bond prices. This will cause rates to rise again and the cycle will repeat. Eventually many financially weak companies will be unable to refinance old debts at sustainable interest rates or somethings not at all. Bond investors are known for understanding company trouble months or even years before stock investors but share prices will fall sooner than later. So by monitoring junk bonds we have an early indicator for stocks.
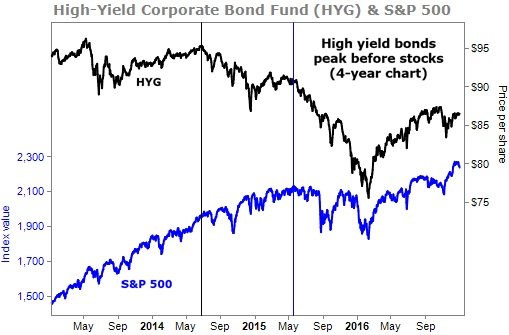
Let's take a look at 2015 as an example. Using iShares iBoxx High Yield Corporate Bond Fund (HYG) which is one of the largest and most liquid ways to gain exposure to junk bonds.
See below HYG shares (black line) peaked in 2014. The warning flag shown as lower highs and lower lows.
( )
)
S&P 500 Index (blue line) took until 2015 to peak. The US stock market then went through a period of lower highs and lower lows. By using this warning signal investors can either protect themselves by raising cash (selling stock) or buy stock market protection by shorting stocks or buying put options.
As you can see below a similar process is currently in the works.
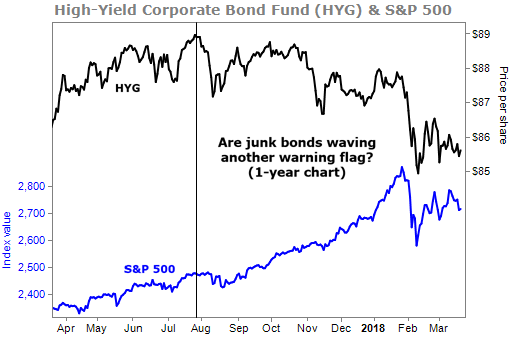
Investors need to monitor HYG for junk bond prices to stabilize before the stock market is in the clear. Should this happen it may make sense to start adding to your best stock market investments.
However, if HYG continues lower be more cautious as the stock market can continue on a wild ride for a while just like in 2015.

Disclosure: I wrote this article myself, and it expresses my own opinions. I have no business relationship with any company whose stock is mentioned in this article.
I am not an analyst but it seems like common sense to expect a stock market crash similar to 2008, since little has really been done to keep that from happening again. How can we continue to print fiat money in the presence of so much debt without an eventual collapse?
Good point. Many people think the same thing. We will see how long global central banks can keep the plates spinning.