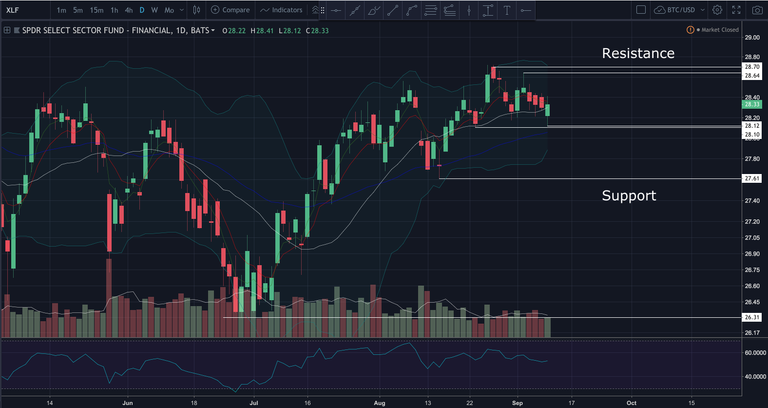
XLF (Financial Sector) had a bear break today and made a lower low on the daily time frame, but the bulls managed to buy the dip before breaking the daily support of $28.10 and closed just above the middle Bollinger band (20MA). Next resistance for the bulls is $28.64 and the all time high of $28.70. Support is the low of Tuesday at $28.12 and the last daily higher low of $28.10 and then $27.61
XLF Daily Chart

If you follow me, I will also follow you in return!
@ccoldwell, I gave you a vote!Enjoy some !popcorn courtesy of @nextgencrypto!