Look like we are back to $100,000 pric range, let's see what the chart say.
Technical Analysis:
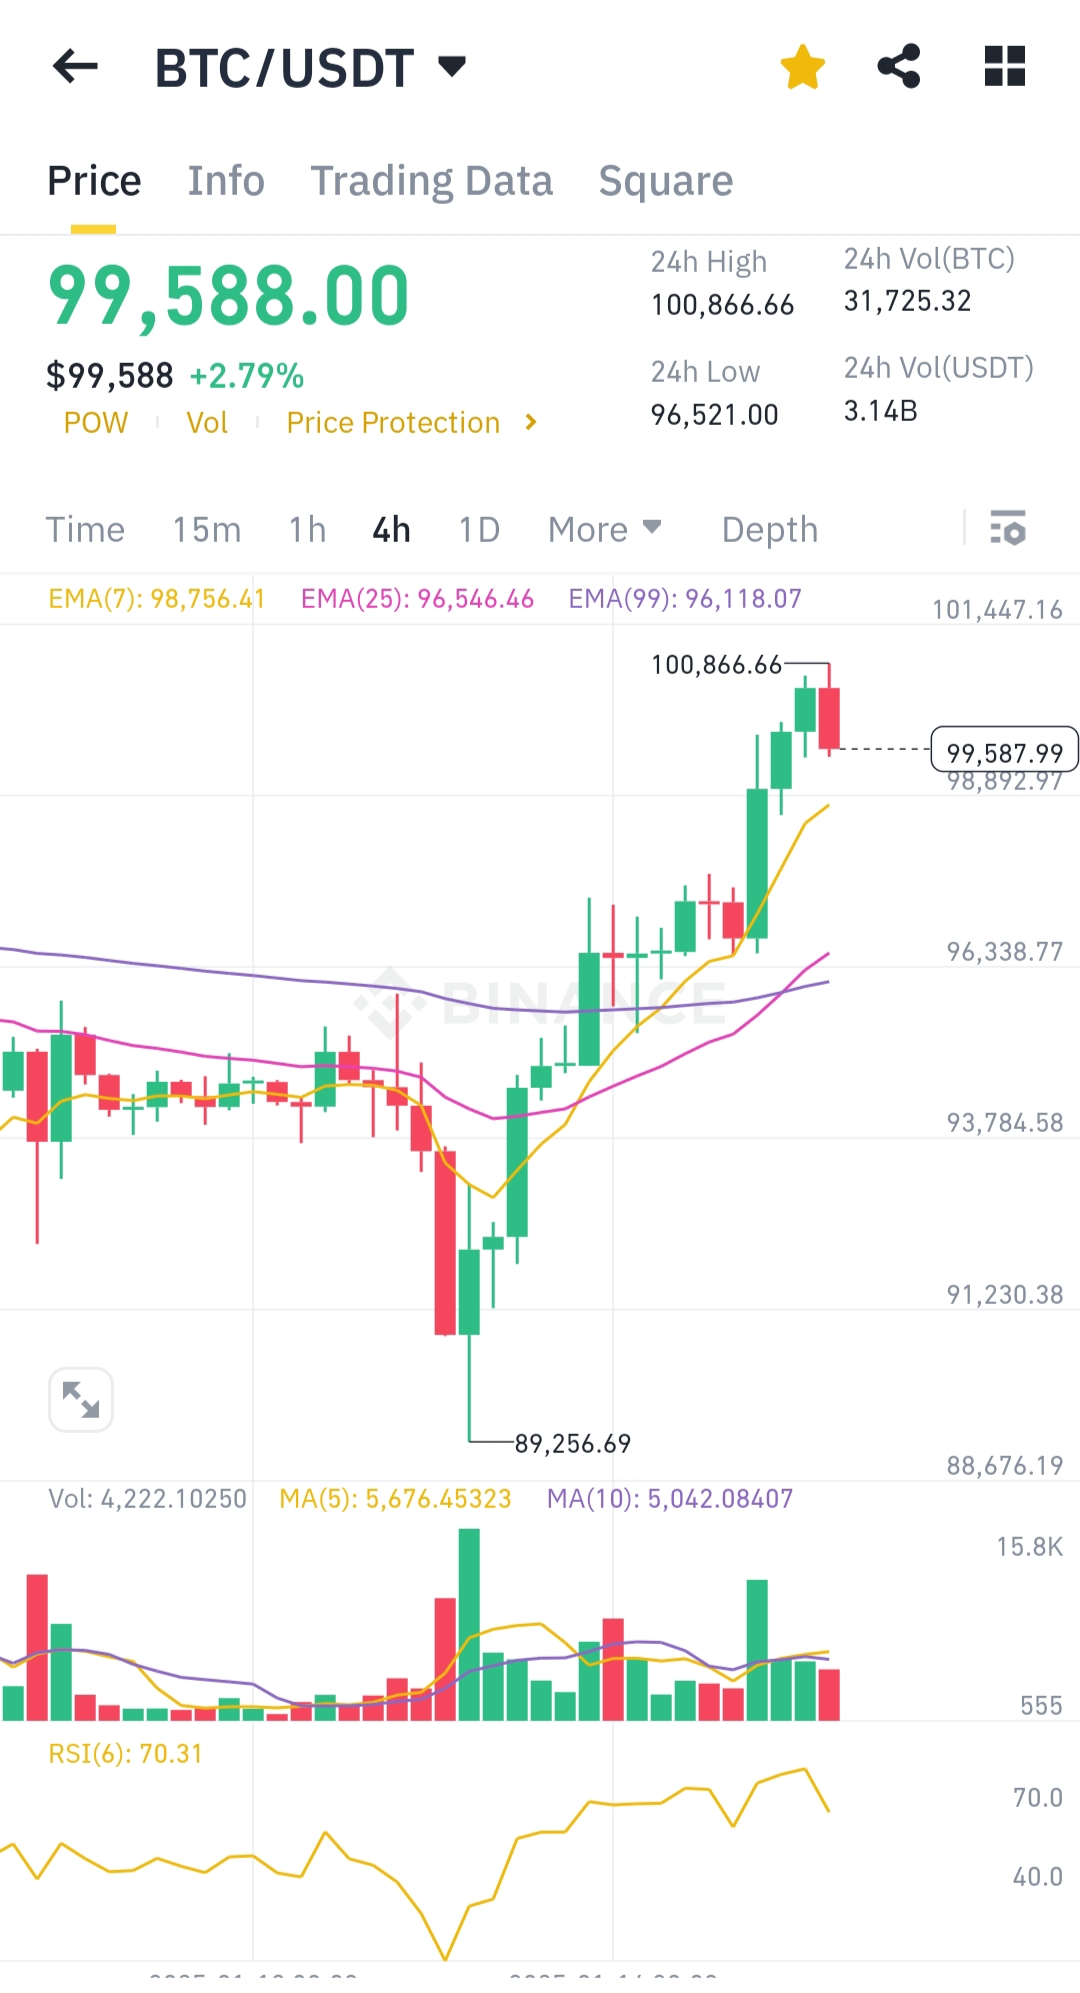
Price Action: Bitcoin is trading at $99,588, up 2.79% in the last 4 hours, approaching a key psychological resistance level of $100,000.
Moving Averages:
- EMA (7): $98,756 (short-term support).
- EMA (25): $96,546 (mid-term support).
- EMA (99): $96,118 (long-term trend support).
- The price is trading above all major EMAs, indicating strong bullish momentum.
RSI (6): At 70.31, the RSI indicates Bitcoin is nearing overbought territory, suggesting a potential for profit-taking or a short-term pullback.
Volume: An increase in volume is observed during the recent bullish surge, indicating strong buying pressure.
Key Levels:
- Resistance: $100,866 (recent high and key psychological barrier).
- Support: $96,338 (local low and EMA cluster zone).
Conclusion:
Bitcoin is in a strong uptrend, but the overbought RSI and psychological resistance near $100,000 suggest a possible short-term consolidation or pullback before a decisive breakout.
I think Bitcoin can drop 50.000 Fiat USD's in a Single Day, once USCC is revealed...