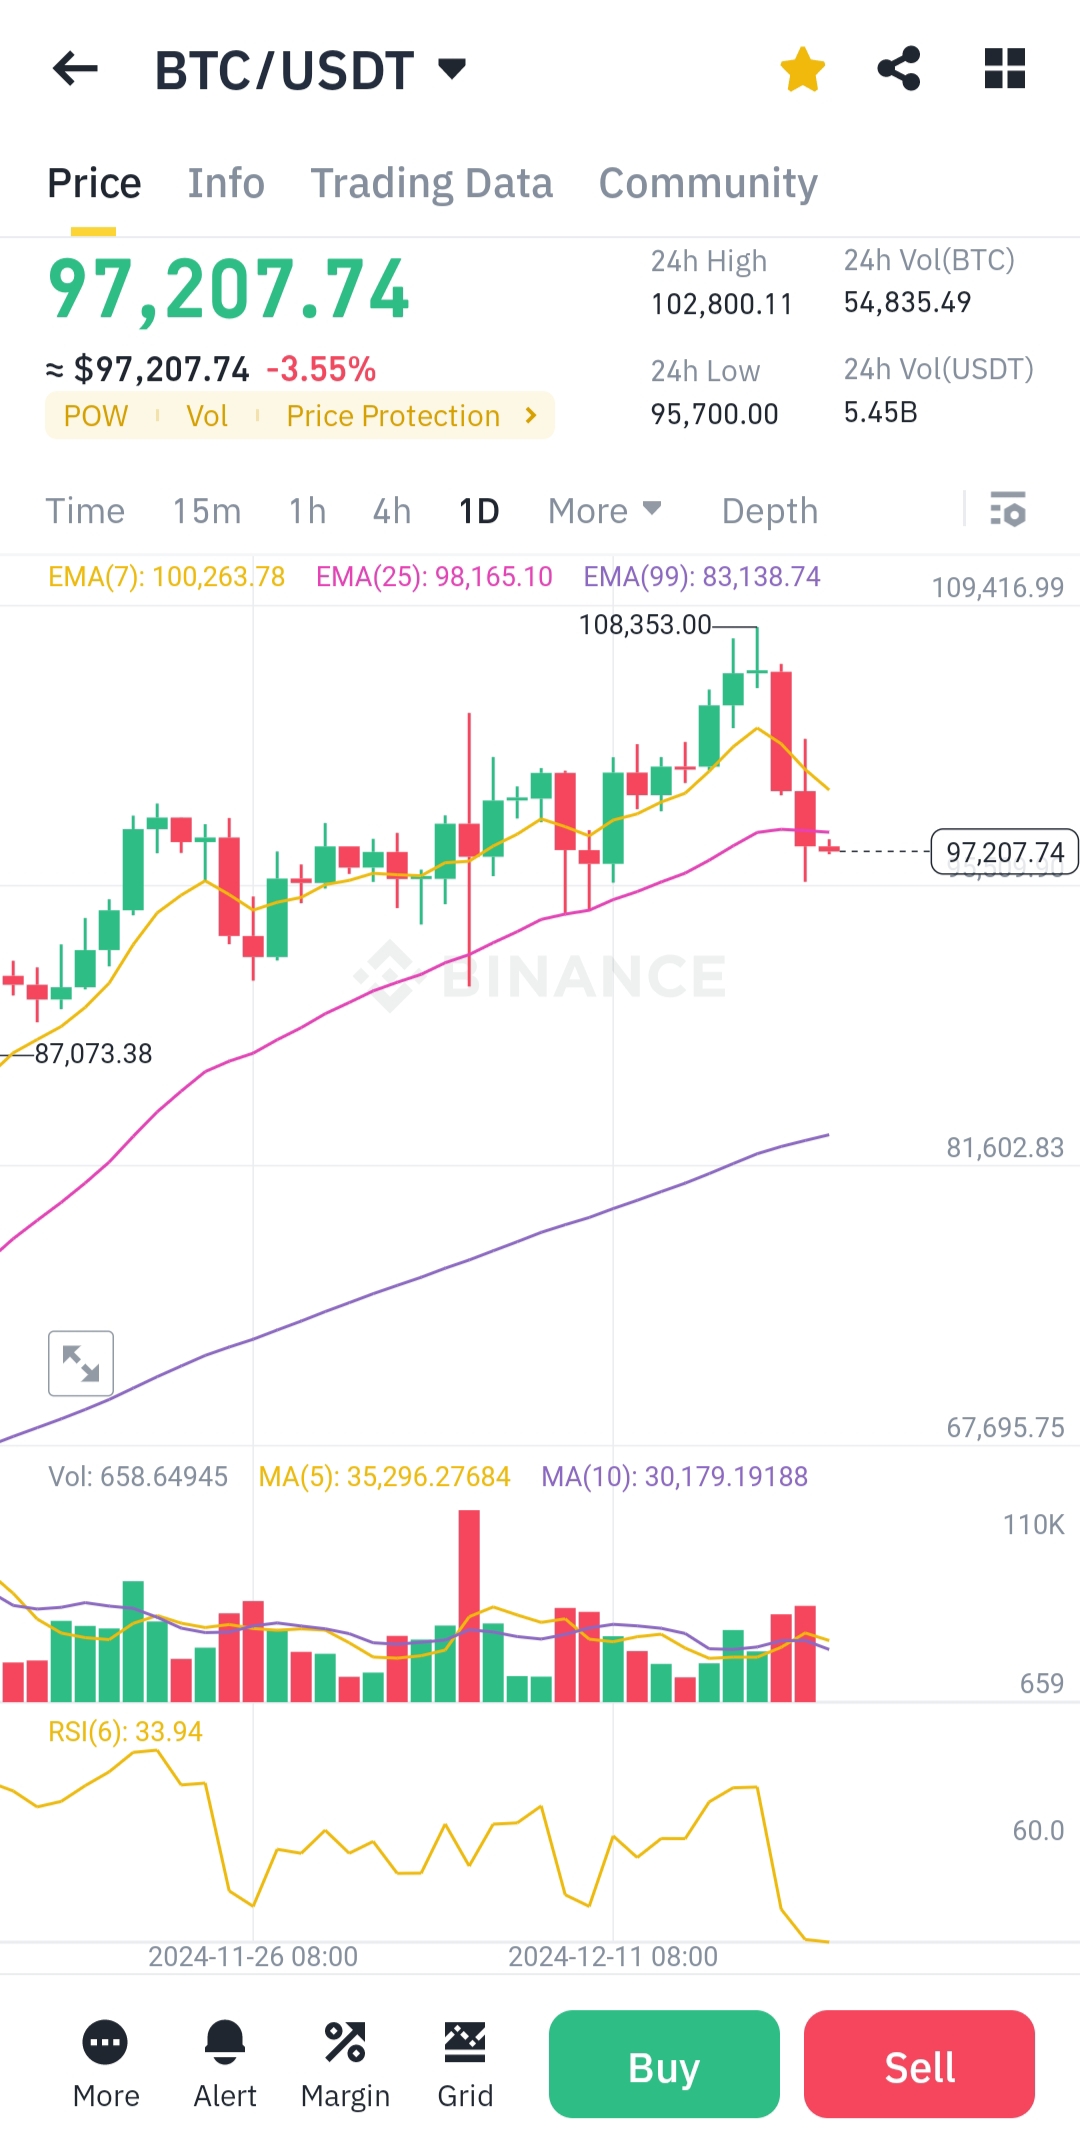
Look like BTC take a heavy beating last 24 hours, it went from $108,000 to now near $97,000. Let's see what the chart say about BTC.
Here is the technical analysis of BTC/USDT
1. Price Movement and Trend
- Current price: $97,207.74 (-3.55%).
- 24-hour range: High of $102,800.11, low of $95,700.00.
- The price has dropped below the EMA (7) ($100,263.78) and EMA (25) ($98,165.10), suggesting bearish momentum in the short term.
2. Exponential Moving Averages (EMA)
- EMA (7) is above EMA (25), indicating that the short-term trend was recently bullish but is weakening as the price approaches EMA (99) ($83,138.74).
- The price currently tests EMA (25), which may act as temporary support. If it breaks below, we could see further downward movement toward EMA (99).
3. Volume Analysis
- The volume is moderate, with no significant spike indicating massive buying or selling pressure. The lack of volume during a pullback suggests potential for further downside unless buying increases.
4. Relative Strength Index (RSI)
- Current RSI (6): 33.94.
- The RSI is near the oversold zone (below 30), indicating selling pressure but also the possibility of a short-term bounce if buyers step in.
5. Candlestick Patterns
- Recent red candles show strong selling pressure, with wicks indicating attempts by bulls to defend key levels but failing to sustain upward momentum.
6. Support and Resistance Levels
- Support:
- $95,700 (recent low).
- $83,138 (EMA 99 and major support zone).
- Resistance:
- $100,000 (psychological level and EMA 7).
- $102,800 (24-hour high).
Conclusion
The current chart indicates weakening bullish momentum, with the price breaking below short-term moving averages and RSI nearing oversold levels. The failure to hold $100,000 could signal that the bull run is under threat unless there’s a strong rebound supported by higher volume.
Will BTC go back to $100,000?
If the price holds above $95,700 and bounces back with increasing volume, a retest of $100,000 is possible in the near term. However, failure to maintain this level and a further drop toward EMA (99) at $83,138 could signal the end of the current bull run, at least temporarily. A decisive move above $100,000 is required to confirm renewed bullish momentum.
You received an upvote of 16% from Precious the Silver Mermaid!
Thank you for contributing more great content to the #SilverGoldStackers tag.
You have created a Precious Gem!
Over? Nah. It hasn't even really begun yet. It will keep bouncing sideways until it corrects to the 80k level, then after Trump takes office it will take off again.
Maybe :)
I'm expecting BTC to make new highs after the returning Prez takes office.