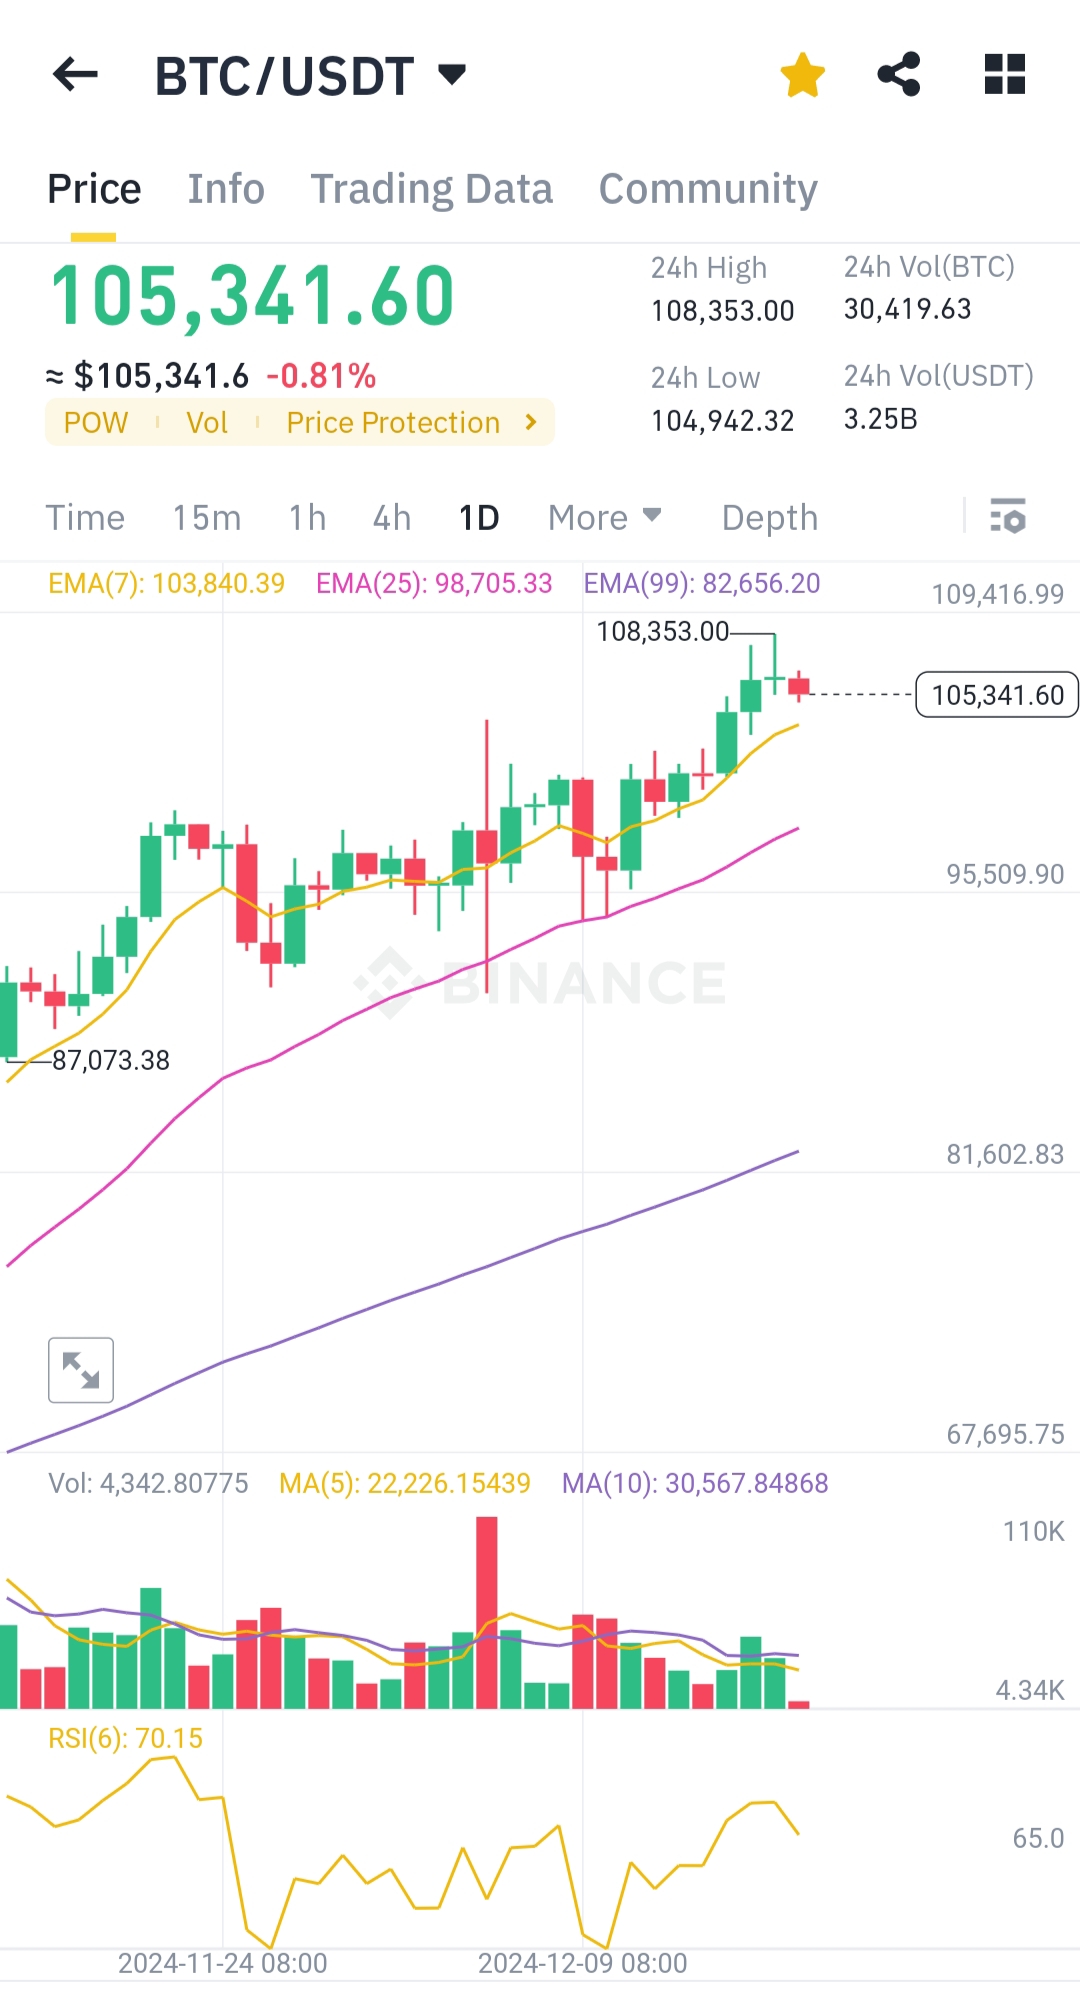
Last 24 hours we see Bitcoin briefly touch $108,000. With Christmas only 1 week away, are we going witness a $110,000 by then? Let's see what the chart say
Technical Analysis of Bitcoin Chart
1. Current Price & Trends
- Price: $105,341.60, down by -0.81% in the short term.
- 24H High: $108,353.00, showing a strong upside test but met resistance.
- 24H Low: $104,942.32, indicating buyers are still active near this range.
The 7-day EMA (yellow) at 103,840.39 acts as immediate support, with price trading above it. The 25-day EMA (magenta) at 98,705.33 and the 99-day EMA (purple) at 82,656.20 suggest an overall bullish trend with clear upward momentum.
2. Key Support and Resistance
- Immediate Support: $103,840.
- Next Support: $95,509.90.
- Resistance: $108,353.00 (recent high).
Breaking and holding above this resistance will be key for a new ATH (All-Time High).
3. Volume Analysis
Volume is relatively moderate (4.34K BTC), but a spike is noticeable on December 9th, indicating potential renewed buying interest. Sustained higher volumes are needed for a stronger breakout.
4. RSI (Relative Strength Index)
The RSI(6) is at 70.15, nearing overbought territory (70+). This suggests caution for short-term pullbacks, though it also confirms strong upward momentum.
Conclusion
Bitcoin is in a bullish uptrend with strong EMA support, but faces resistance near $108,353.00. If BTC breaks this level with volume confirmation, the possibility of testing or setting a new ATH becomes high. Short-term overbought conditions could cause minor corrections, but the long-term trend remains bullish.