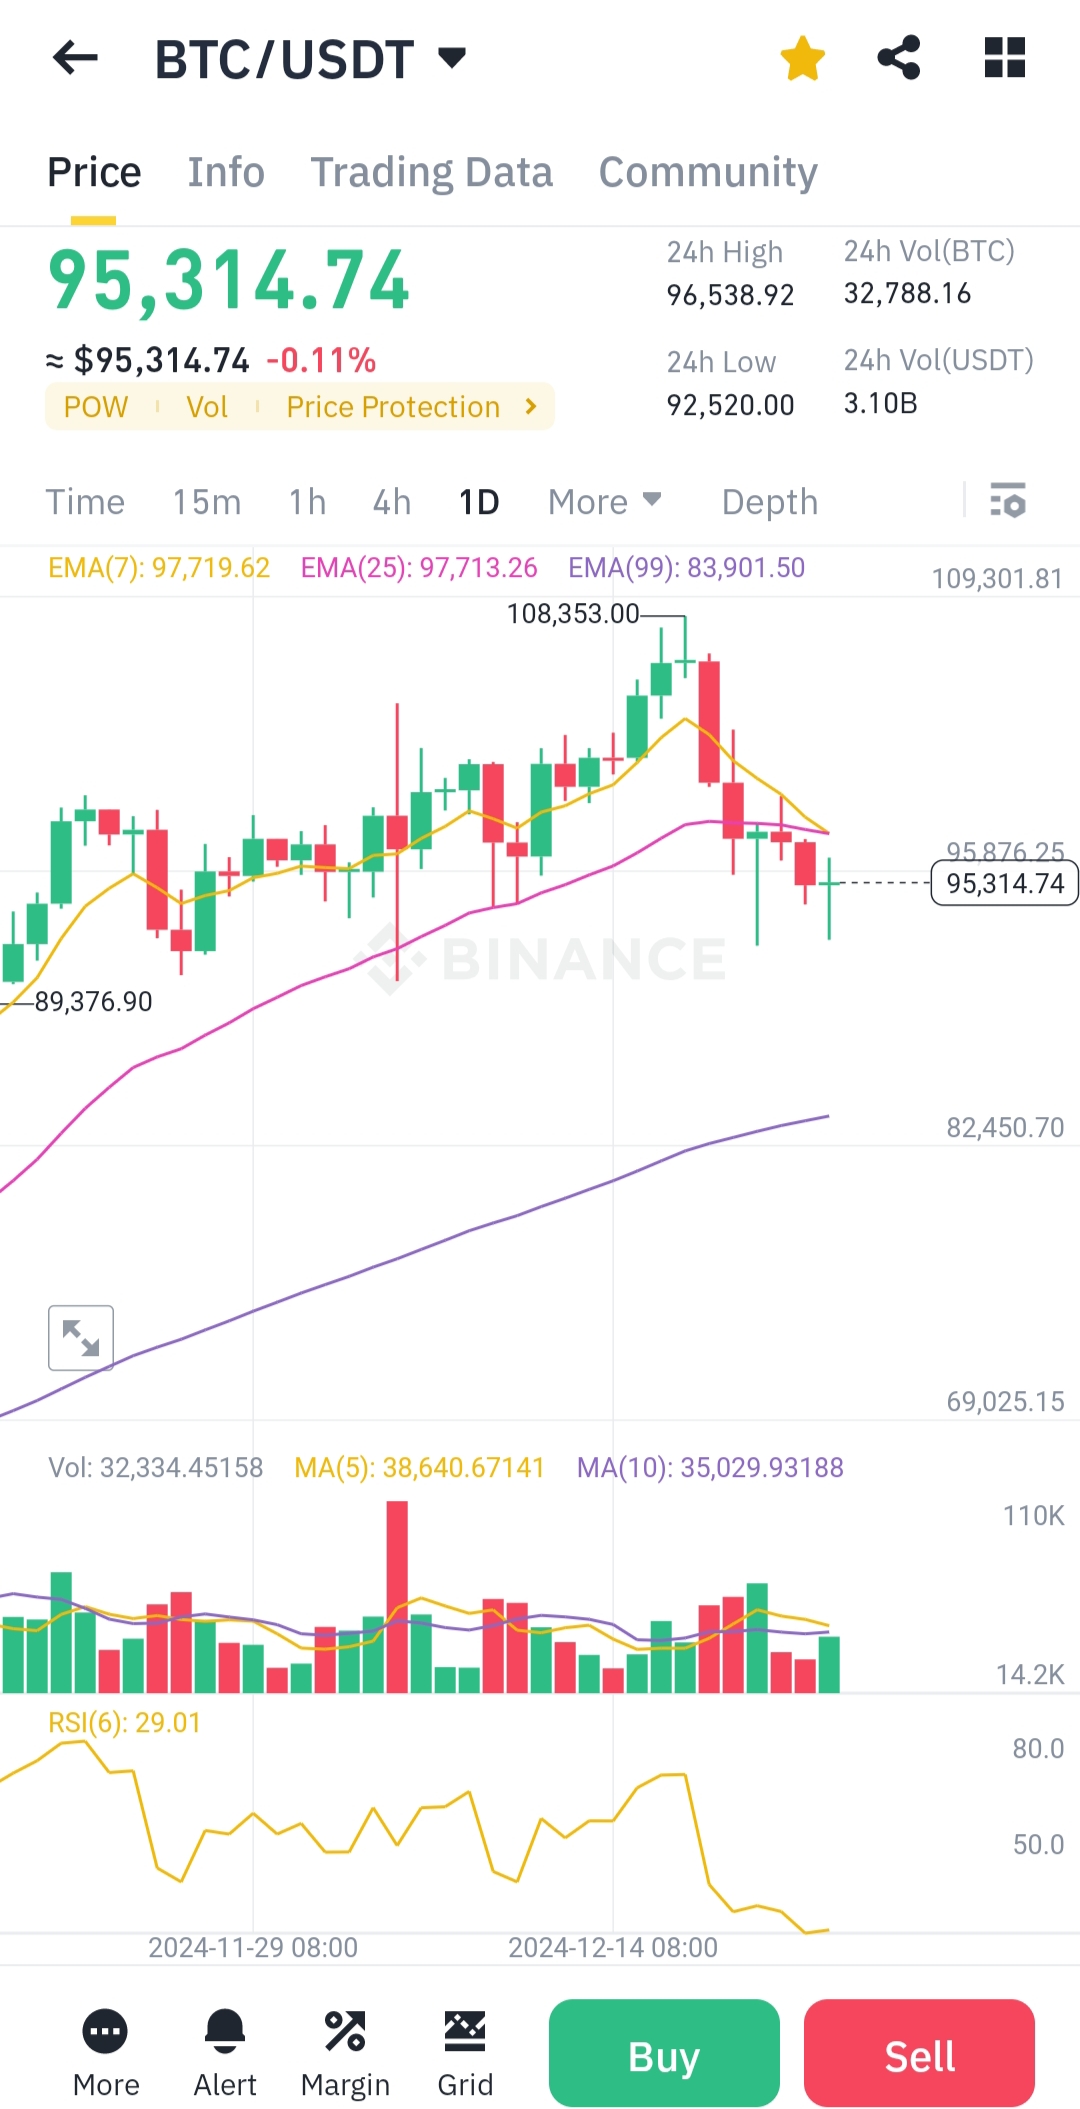
BTC/USDT Technical Analysis (1-Day Chart)
Based on the chart you provided, here is a detailed analysis of BTC/USDT:
Key Observations:
Price Action:
- Current price: $95,314.74.
- The price is trending below the 7 EMA ($97,719.62) and 25 EMA ($97,713.26), indicating short-term bearish momentum.
- Recent candles suggest indecision in the market with smaller-bodied candles following the downtrend, signaling potential consolidation.
Moving Averages:
- The 7 EMA (yellow) is sloping downward, indicating bearish pressure in the short term.
- The 25 EMA (pink) is just above the price, acting as resistance.
- The 99 EMA ($83,901.50) (long-term trend) remains far below the current price, suggesting that the broader trend is still bullish, but the current retracement is significant.
Support and Resistance:
- Resistance Levels:
- $97,700–$98,000 (near 7 EMA and 25 EMA): Immediate resistance zone.
- $108,353: Previous local high, a significant psychological and technical barrier.
- Support Levels:
- $92,500–$93,000: Closest strong support zone where buyers might step in, as the price bounced near here before.
- $89,376: A key lower support level from previous price action.
- Resistance Levels:
Volume:
- Recent volume appears declining, which often precedes significant moves in either direction.
- Bullish reversals typically require a spike in volume to confirm.
RSI (Relative Strength Index):
- RSI is at 29.01, which is close to the oversold level of 30.
- This suggests that the market is in oversold territory, and a potential rebound might occur soon.
Market Structure:
- The chart indicates lower highs and lower lows, which is characteristic of a downtrend.
- A breakout above the $97,700–$98,000 zone would invalidate this bearish structure and potentially signal a reversal.
Possible Scenarios:
Bullish Scenario:
- If BTC breaks above the $97,700–$98,000 resistance, it could target the next resistance at $108,353.
- RSI near oversold levels suggests that a short-term rebound is possible.
Bearish Scenario:
- If BTC fails to break above $97,700 and closes below $92,500, further downside to $89,376 is likely.
- A breach below $89,376 would signal stronger bearish momentum, targeting even lower support levels.
Key Indicators Summary:
- EMA Trend: Bearish in the short term (below 7 and 25 EMAs).
- RSI: Oversold territory, indicating a potential for reversal.
- Volume: Low, which suggests market indecision.
Trading Strategy Based on Analysis:
For Bullish Traders:
- Consider entering above $97,700, with stop-loss around $92,500.
- Take profit near $108,000.
For Bearish Traders:
- Consider shorting if the price breaks below $92,500, with stop-loss at $97,700.
- Take profit near $89,000–$89,500.
Grid Trading Setup Suggestion:
- Range: $92,000 (support) to $97,500 (resistance).
- Grids: Use 8–10 levels to maximize volatility within this range.
- Enable trailing up only if the price consistently breaks above $97,700.
Final Thoughts:
BTC/USDT appears to be in a short-term downtrend with oversold RSI, suggesting potential for a relief rally. Watch for volume spikes and price movement around critical support and resistance levels to confirm any trend reversals or continuation.
You received an upvote of 38% from Precious the Silver Mermaid!
Thank you for contributing more great content to the #SilverGoldStackers tag.
You have created a Precious Gem!