Technical Analysis:
Price Movement:
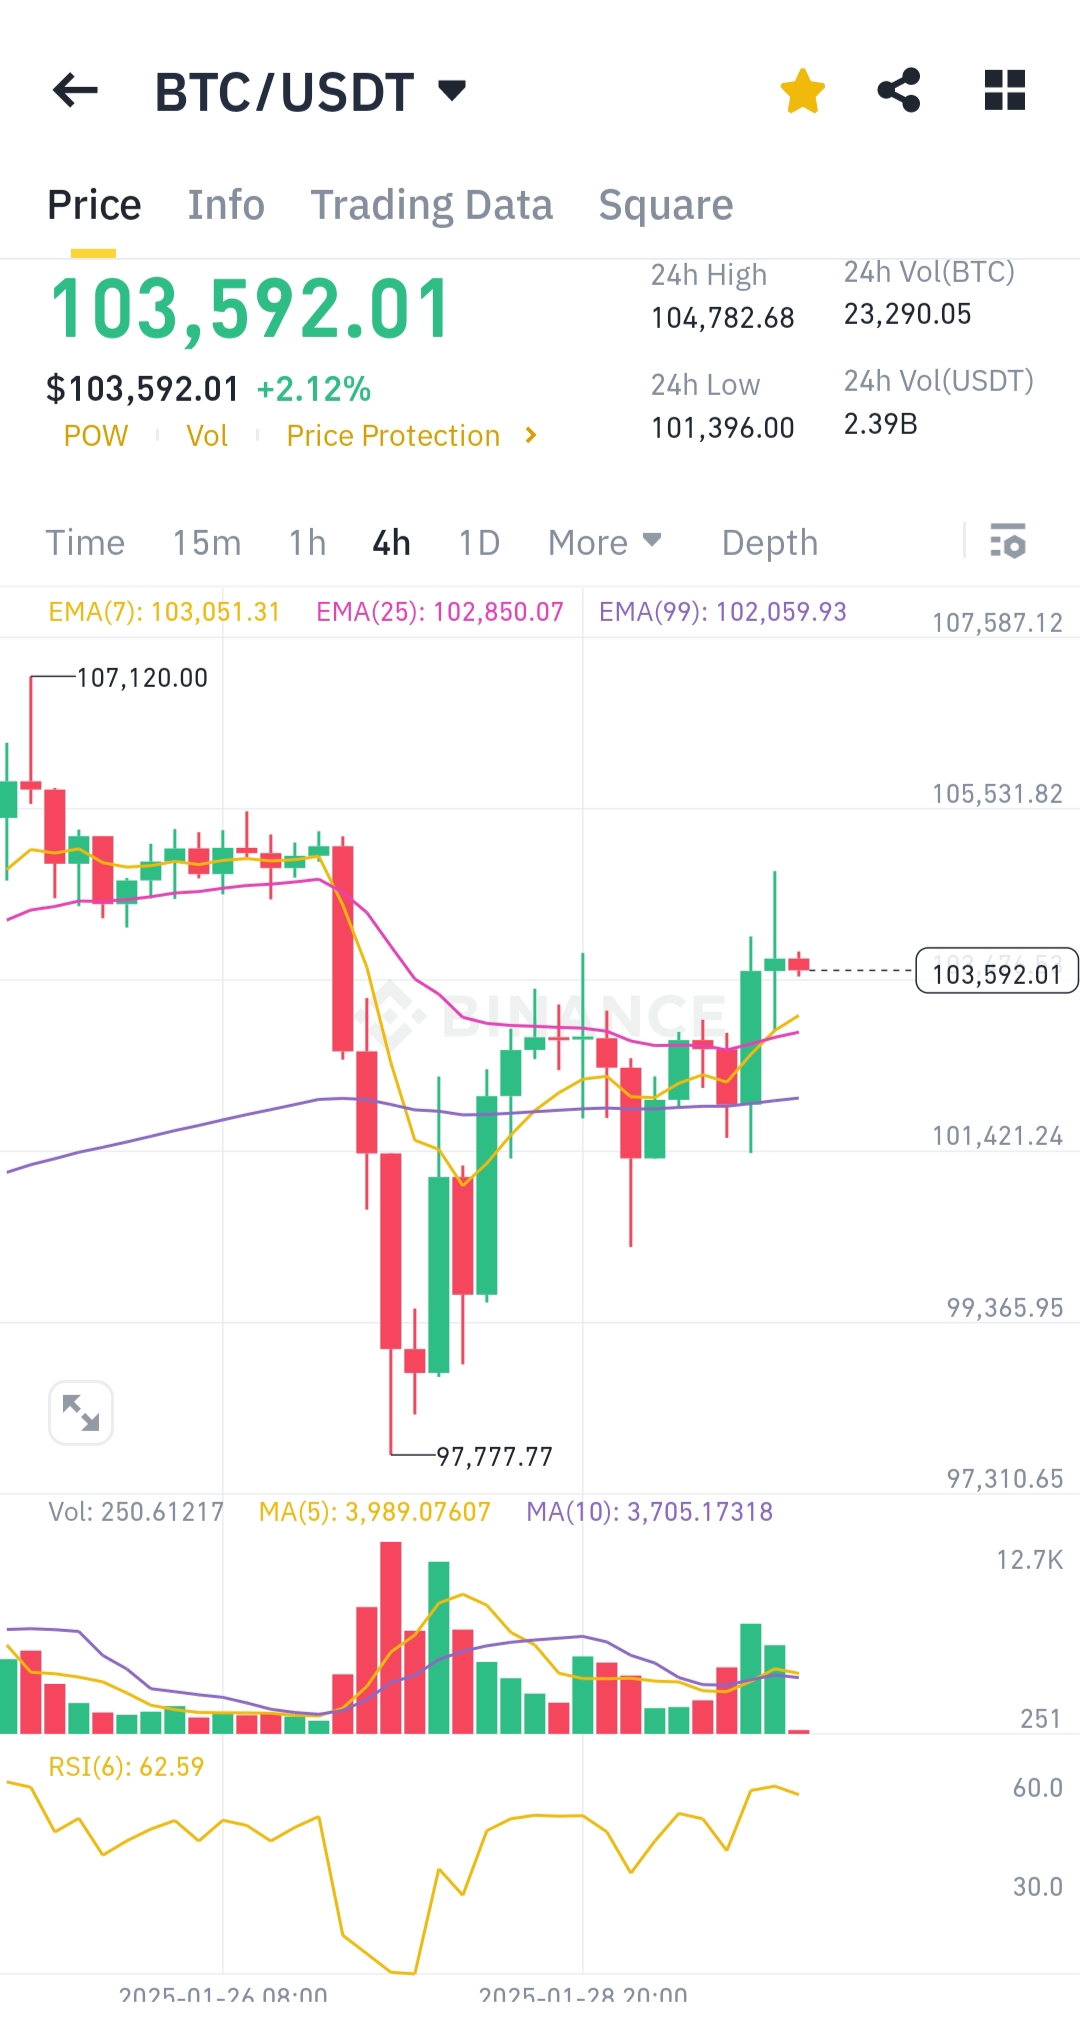
- Current price: $103,592.01 (+2.12%).
- 24-hour high/low: $104,782.68 / $101,396.00.
Moving Averages:
- EMA(7): $103,051.31 — Indicates short-term bullish sentiment as the price is trading above EMA(7).
- EMA(25): $102,850.07 — Near convergence with EMA(7), signaling potential stability or upward momentum.
- EMA(99): $102,059.93 — Long-term bullish trend intact.
Volume:
- Volume is moderate, suggesting cautious optimism among traders. The upward trend in recent candlesticks aligns with increasing buying interest.
RSI (6):
- RSI at 62.59 — Indicates bullish momentum but not overbought. There is room for further upward movement.
Key Levels:
- Resistance: $107,120.00 — Needs to break for a stronger rally.
- Support: $101,421.24 — Strong base preventing significant downside.
Conclusion:
Bitcoin shows signs of short-term recovery with bullish momentum supported by RSI and EMA indicators. However, a break above $107,120 is crucial to sustain upward momentum. Maintain cautious optimism.