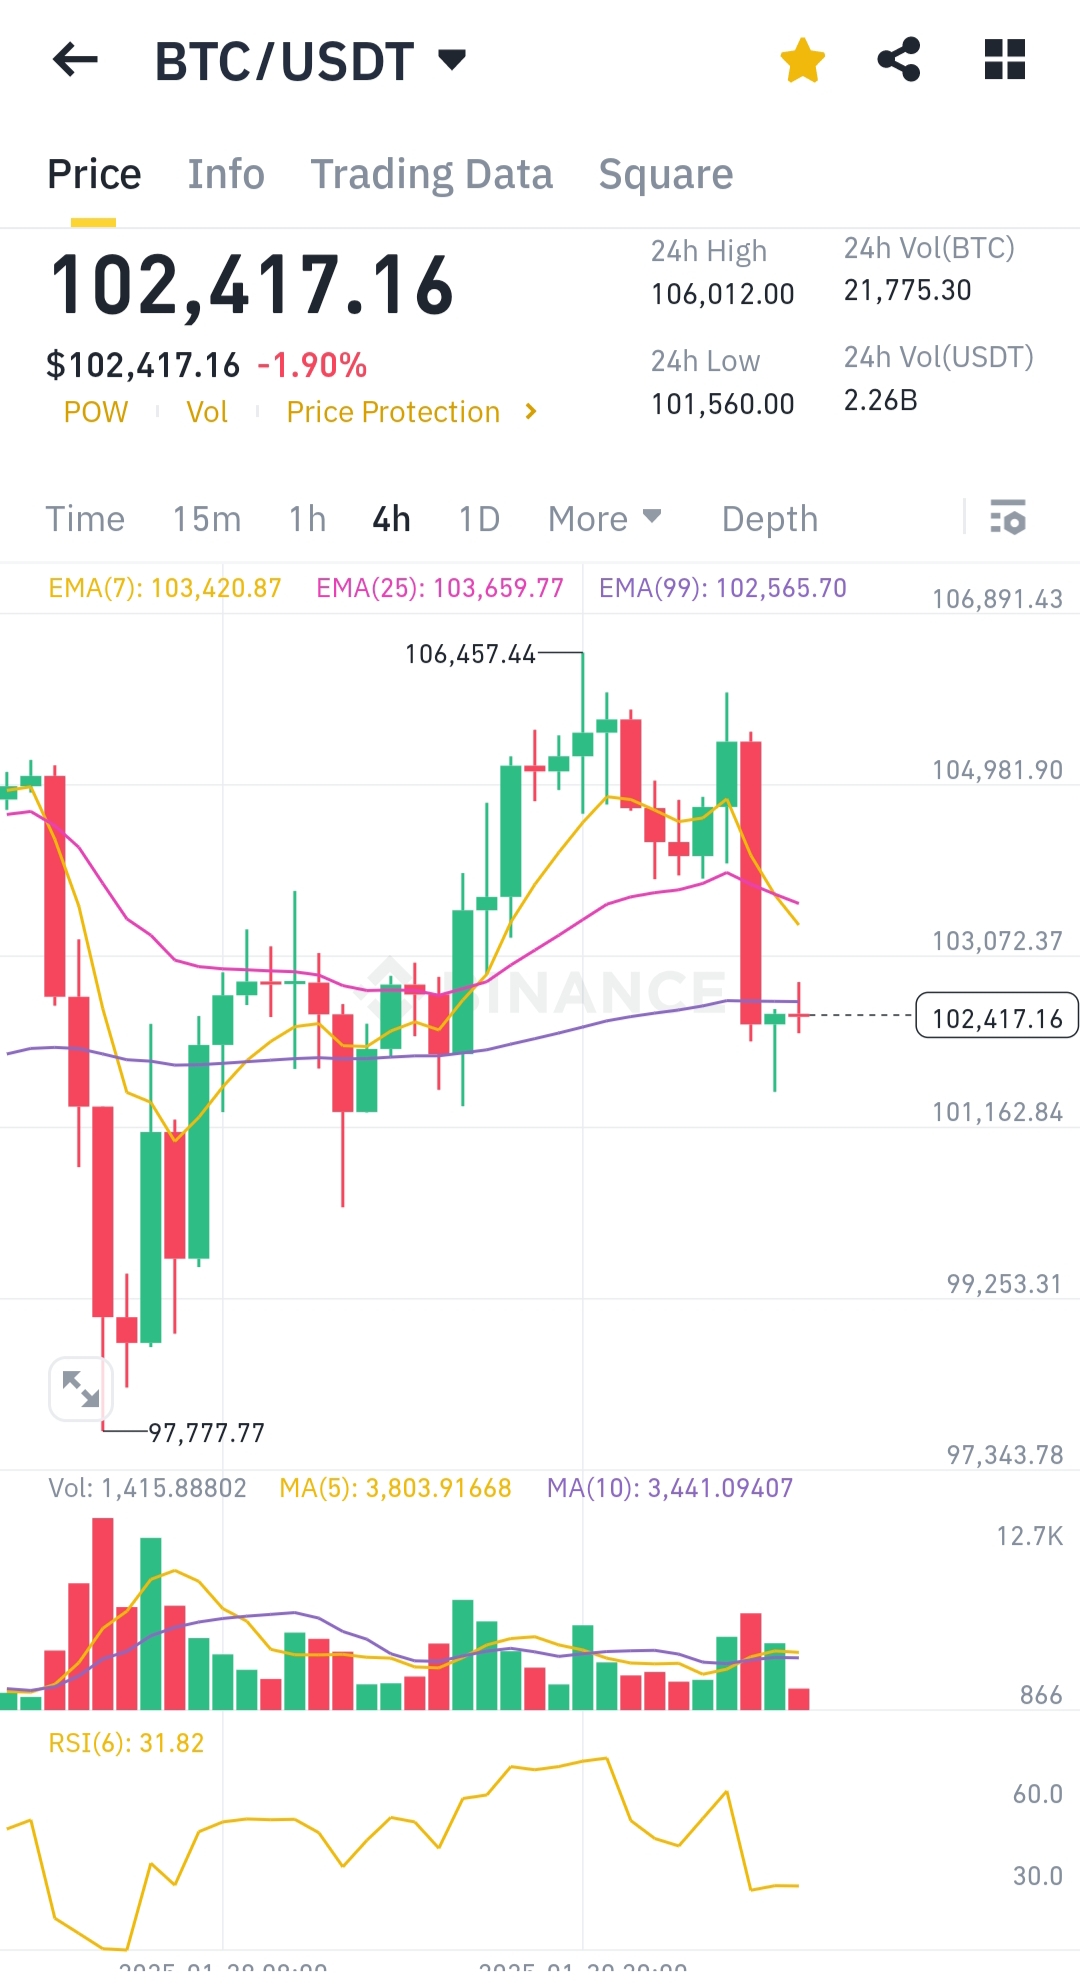
Technical Analysis:
Price Movement: Bitcoin is currently trading at $102,417.16, showing a slight decline of 1.90% over the last 24 hours. The price has fluctuated between a 24-hour high of $106,012.00 and a low of $101,560.00.
Exponential Moving Averages (EMA): The EMA(7) is at 103,420.87, EMA(25) at 103,659.77, and EMA(99) at 102,565.70. The price is below the shorter-term EMAs, indicating a bearish trend in the short term.
Volume: The 24-hour trading volume for BTC is 21,775.30, with a USDT volume of 2.26 billion. This suggests moderate trading activity.
Moving Averages (MA): The MA(5) is at 3,803.91668, and MA(10) is at 3,441.09407. These moving averages can provide support and resistance levels.
Relative Strength Index (RSI): The RSI(6) is at 31.82, which is approaching the oversold territory. This could indicate a potential reversal or continuation of the downtrend if it breaks below 30.
Support and Resistance Levels: Key support levels are around $101,162.84 and $97,777.77, while resistance levels are near $103,072.37 and $104,981.90.
Conclusion: Bitcoin is currently in a short-term bearish trend, with key support and resistance levels to watch. The RSI suggests potential for a reversal if it enters oversold territory.