Look like BTC is back to where it was before the sudden dump, let's see what the chart say.
Technical Analysis:
Price Movement:
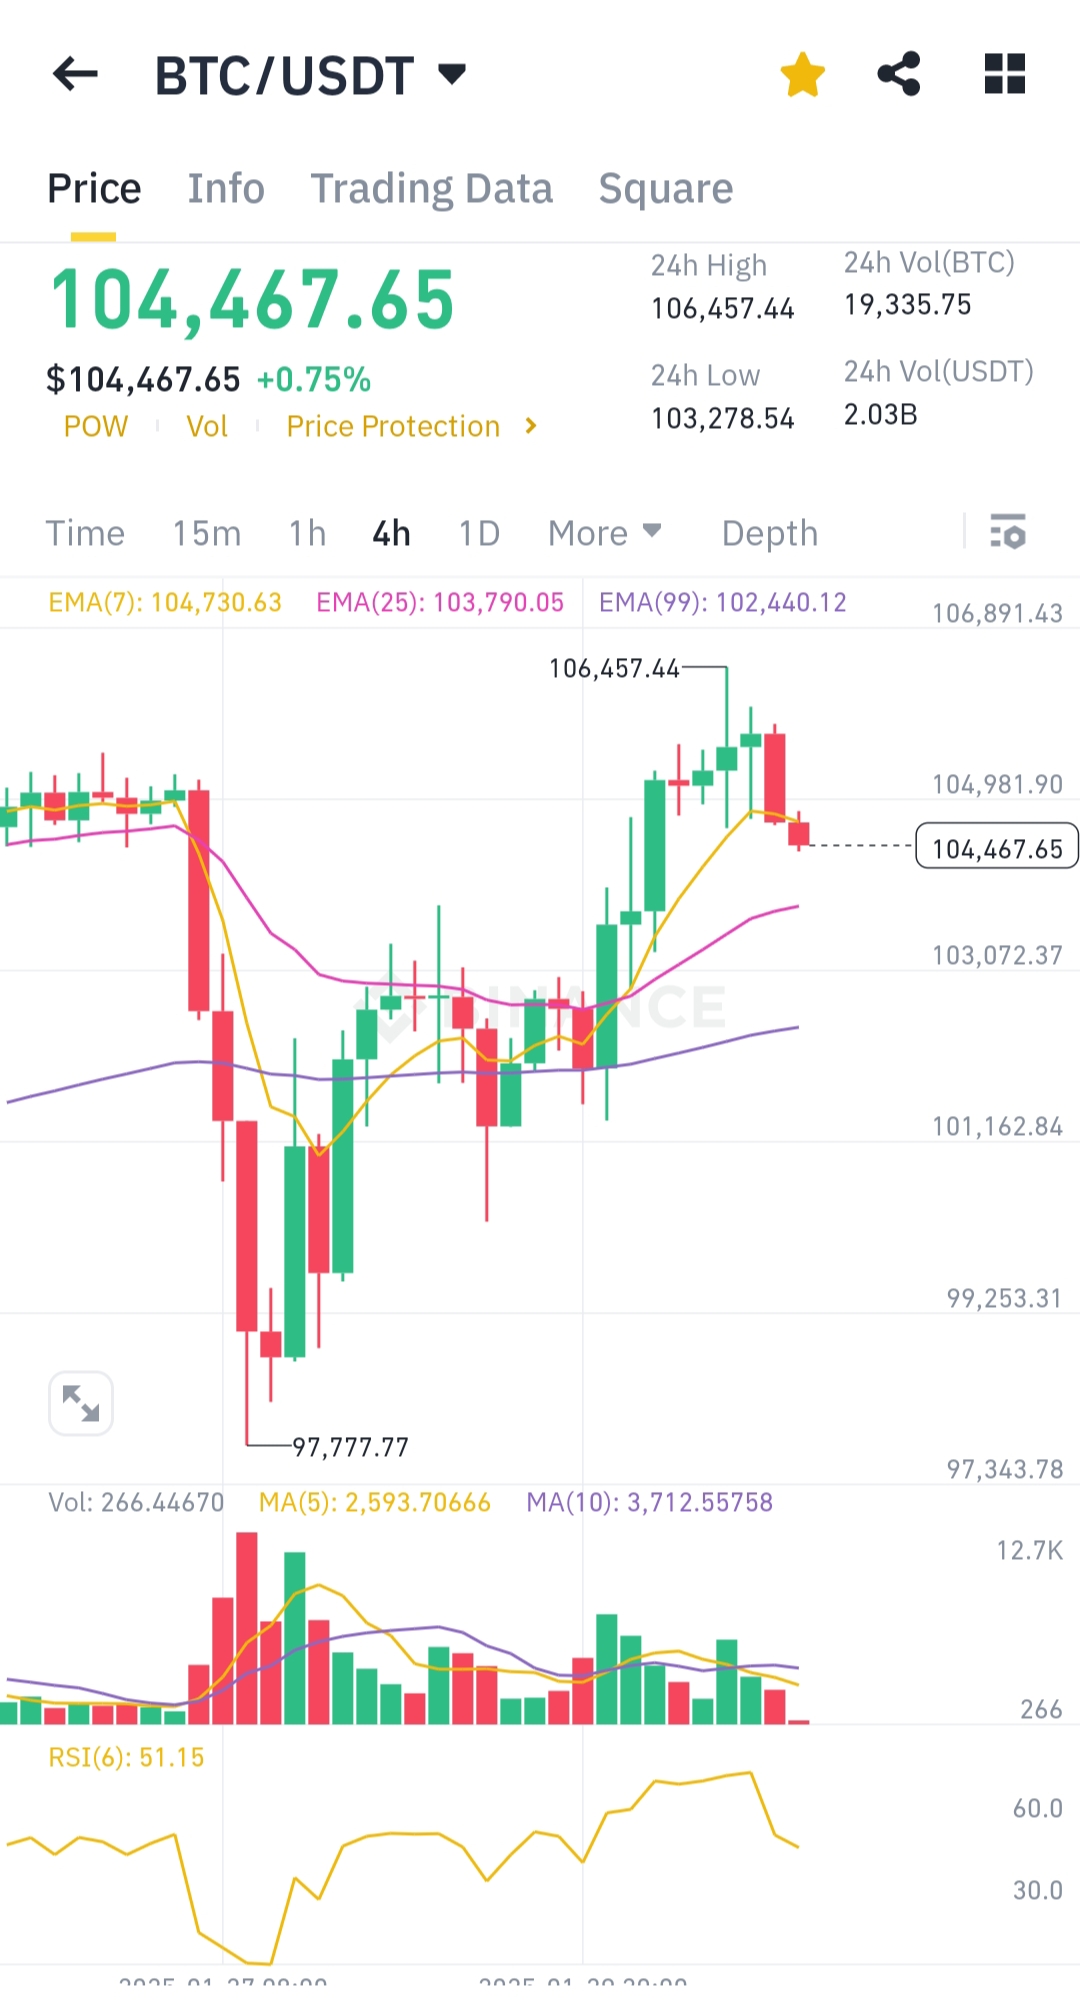
- Current BTC/USDT price: 104,467.65, reflecting a +0.75% increase.
- 24H high: 106,457.44, and 24H low: 103,278.54.
- Price is consolidating near 104,467.65 after a pullback from the recent high.
Moving Averages (MA):
- Short-term EMA(7): 104,730.63 indicates immediate resistance.
- Mid-term EMA(25): 103,790.05 serves as support.
- Long-term EMA(99): 102,440.12 provides major support in case of downward movement.
Volume Analysis:
- Current volume (266 BTC) suggests declining momentum, signaling reduced buyer pressure.
- Volume MA(5): 2,593, and MA(10): 3,712, showing decreased trading activity.
Relative Strength Index (RSI):
- RSI(6) at 51.15 shows neutral momentum, with no strong trend toward overbought or oversold conditions.
Support and Resistance Levels:
- Resistance: 106,457.44 (recent high).
- Support: 103,278.54, with major support near 102,440.12 (long-term EMA).
Conclusion:
BTC/USDT shows consolidation with neutral RSI and diminishing volume. A breakout above 106,457 may trigger bullish momentum, while falling below 102,440 risks further downside.
You received an upvote of 15% from Precious the Silver Mermaid!
Please remember to contribute great content to the #SilverGoldStackers tag to create another Precious Gem.