Bitcoin look like holding steady for now, let's see what the chart say.
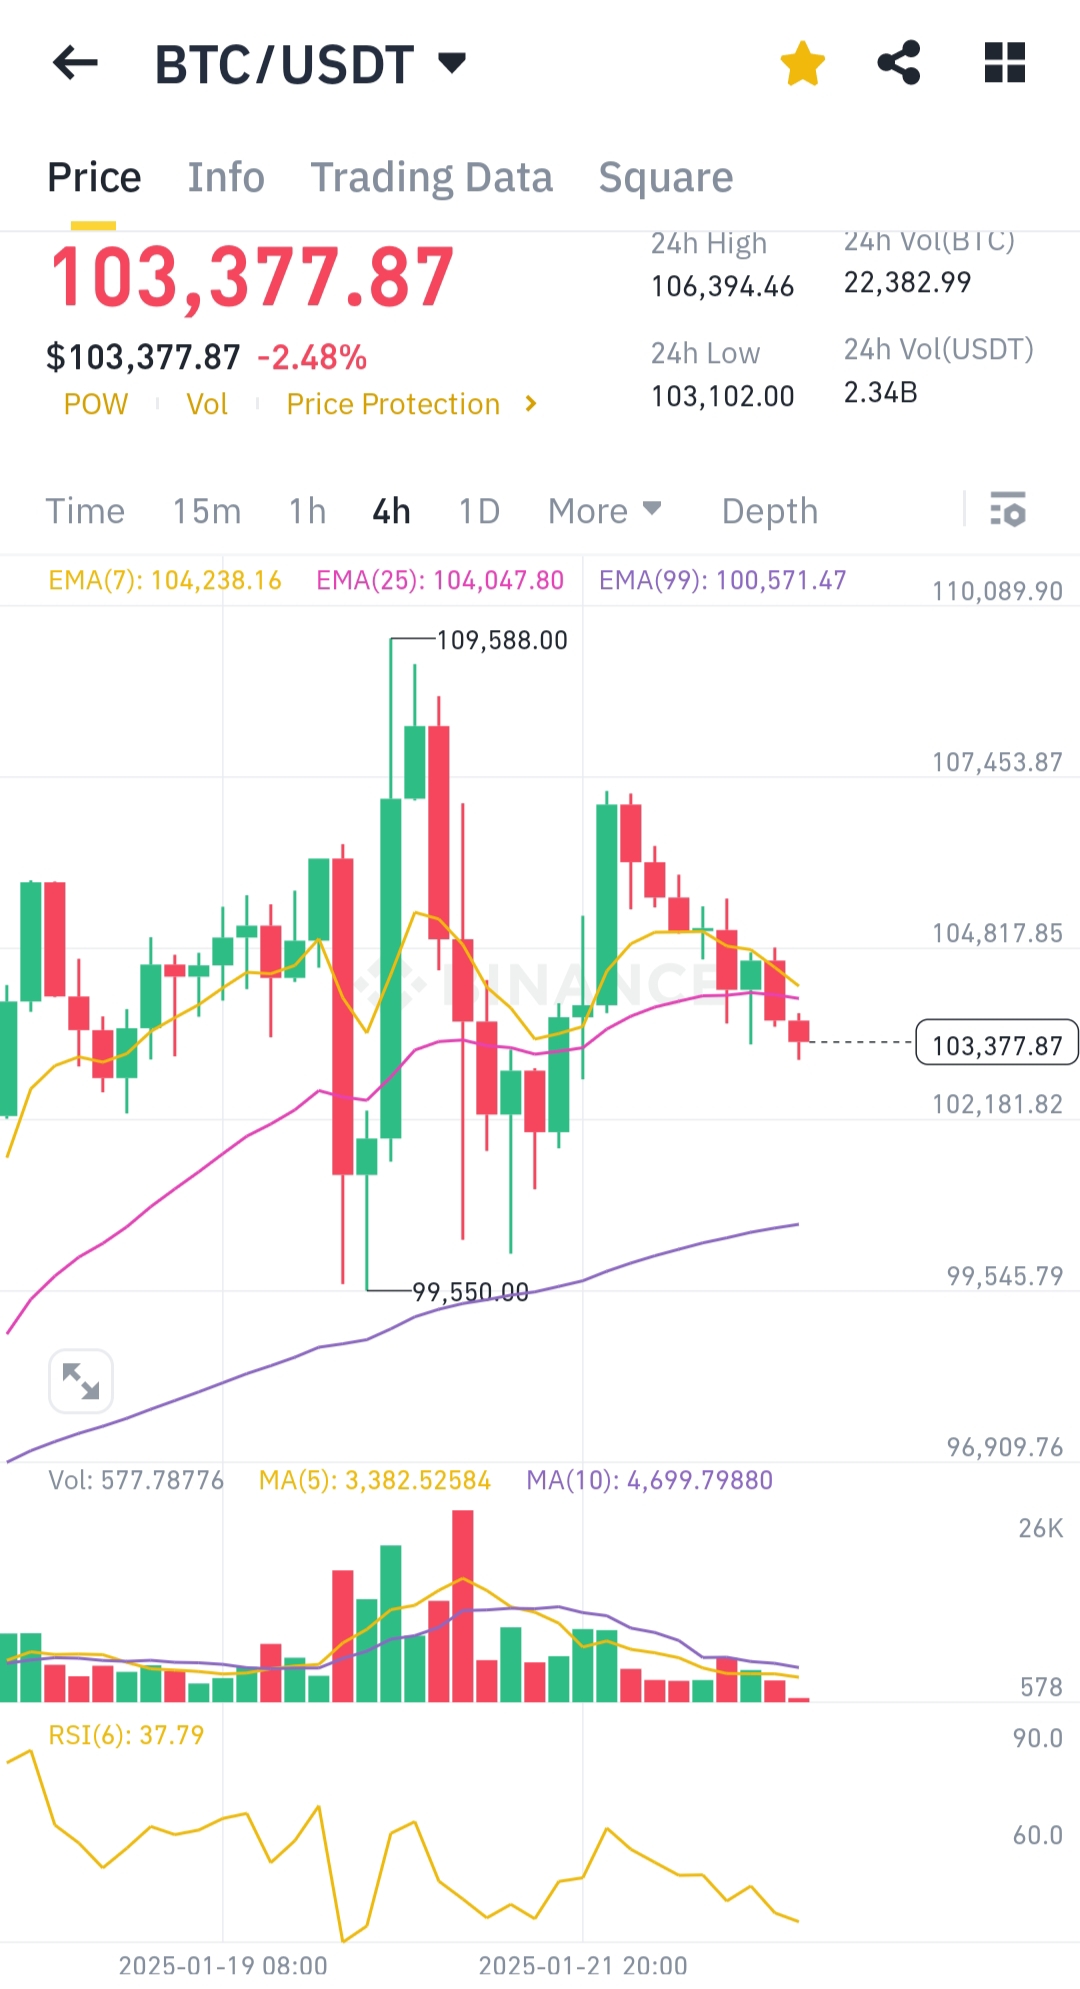
Price Action: Bitcoin's price is trending downward, currently at $103,377.87, marking a -2.48% drop in the last 24 hours. The recent high was $109,588, and the low was $103,102.
Moving Averages:
- EMA(7): $104,238.16 (short-term average above the current price, suggesting bearish sentiment).
- EMA(25): $104,047.80 (also above current price).
- EMA(99): $100,571.47 (long-term trend line still below, indicating moderate support below $101K).
Volume Analysis: Declining trading volume, with the recent average around 577.78, suggests a lack of strong buying or selling momentum.
Relative Strength Index (RSI): At 37.79, the RSI indicates Bitcoin is nearing oversold territory, but it hasn’t hit a strong reversal signal yet.
Support and Resistance Levels:
- Support: $102,181.82 and $99,545.79.
- Resistance: $104,817.85 and $106,394.46.
Conclusion: Bitcoin shows short-term bearish momentum with declining volume. However, long-term support remains intact near $101K. Traders should watch for stronger price or volume signals before taking action.