@EpicDesigns Technical Analysis Report 3/22/2018
Coin/Asset:
-Bitcoin/USD
Current Price:
-$8530.16
The Technicals:
Time Analysis:
Technicals:
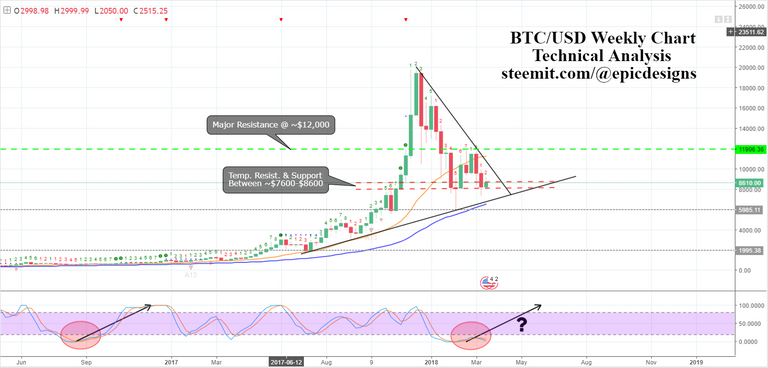
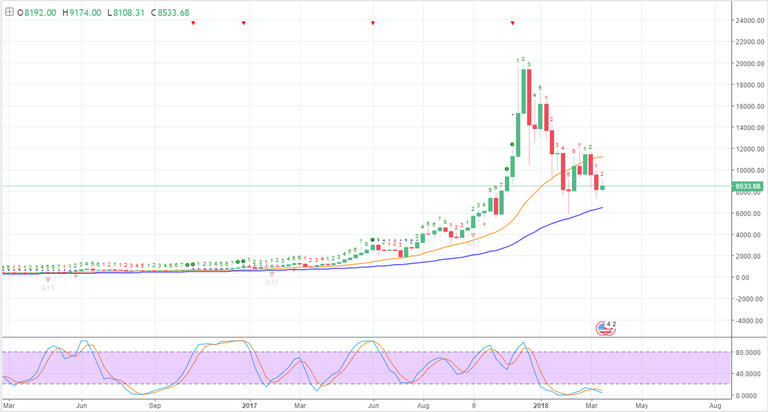
Bullish?.... Looking at the weekly chart we can see the price of bitcoin is almost back to where it was before it went insanely parabolic back in November of 2017, taking the price to all time highs around $20,000. So arguably, we saw the "bubble" pop and we're just returning to the slow but strongly growing market equilibrium we were experiencing before the bull run to $20k. Furthermore, we are extremely oversold on stochRSI, the last time we were this far in oversold territory on the weekly chart was in August of 2016.
Time Analysis:
Bearish.... Looks as if we're in the 2nd week of a possible 1-4 week downtrend. Possible sideways movement between 20d sma and 50d sma? I'll keep you guys updated with my daily chart time analysis, but really the weekly chart is telling me the price is likely to continue dropping. For at least 2 more weeks.
Conclusion:
Is bitcoin just experiencing a typical market correction? Possibly... I personally think as volume grows, the traditional market cycle patterns of bitcoin will still exist but will be experienced on a much more dramatic scale. That being said, bearish markets and major reversals like this aren't unheard of in bitcoin... With larger players getting invested, and more volume entering the market, I believe the frequent price corrections of bitcoin will grow and grow in terms of volatility and much larger swings will take place.
Conclusion continued:
(just me rambling on...lol)
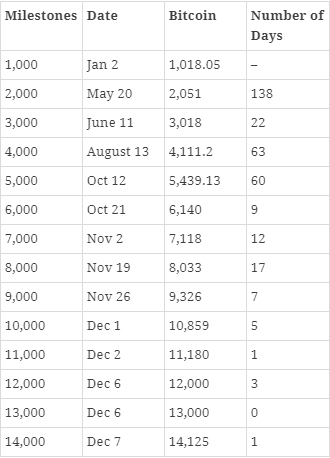
For instance, historically bitcoin normally sees a 30-40% correction in bearish markets, but with mass adoption and increasing volume I think these historic patterns will persist just at completely different rates. Historically, bitcoin has always increased in volatility. Take a look at this table:

The table shows the amount of time (in days) that it took for Bitcoin to reach major price milestones... 60 Days from $3k to $4k, 60 days again from $4k to $5k.. At this time its apparent bitcoin is on a slow but steadily uptrend, but from $5k things started to heat up.
Only 9 days to get from $5k to $6k, and 12 days to $7k, and so fourth... We see bitcoin's momentum grow exponentially up until the $10,000 range. From $10k and on, the price proved to be more volatile than ever.
In the midst of the greatest bull run the world has ever experienced, everyone was feeling skeptical and unsure of the direction of the market, but the typical price patterns that bitcoin has always tended to follow were still obvious to me despite the large volume and increased volatility. And that ultimately helped me call the top of bitcoin around $20k.
Anyhow, I'm feeling bullish today so I'd share my long term thoughts on bitcoin's price with you guys.. Sorry if I rambled on a little too much, the continuation of the conclusion isn't really technical analysis but more price action/historical analysis. Let me know what you guys think :)

