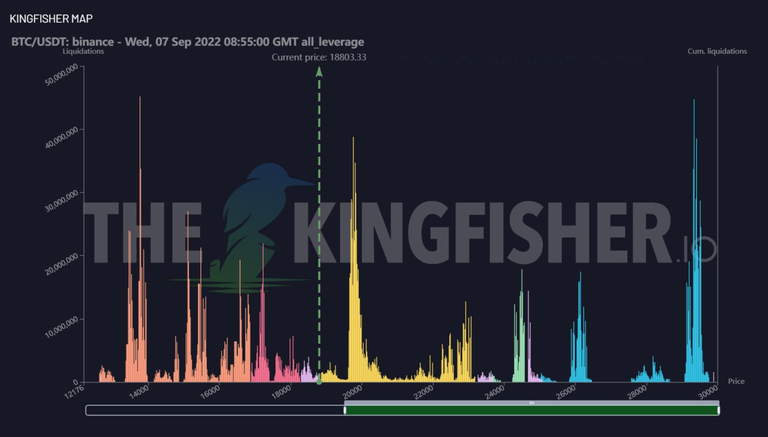
A new big spike in shorts liquidation to the north not far from actual price and it's just settled on the King Fisher Map today, it's between 19.6K to 20.5K
With the price now at 18.8K you have to go up 1.7K to get to 20.5K, but we have quite a few small spikes in the south up to 18K which are close to 18.8K and it shows that Long degens traders are opening trades. positions with big levers between 25X to 50X and see +
In Bear market often sellers have strength on the trend wave, but to trap shorts there's always a way to push the price higher to get them out.
I took a short yesterday on SOL which is almost in the same pattern as BTC.
SOL got rejected almost from the 38.2% fibo, and then it broke the bullish channel from below in confluence with the 50 MA.
For a week we have been in a small upward compression triangle and yesterday we had the candle with the long wick which shows that the sellers are still present and at yesterday's close the triangle gave way from the bottom clearly visible in H4 and today is the pull back.
My bearish targets will be: $28.5 / $27.6 / $26.7 / $25.6 / $24.5 / $23.55
The SL will be at $34.76 or manual in the case of a close above the last higher at $32.5 and to watch the correlation with the BTC and S&P 500!
https://www.tradingview.com/x/RdSJF1Ce/

- Bellow you will find the BTC & ETH Yesterday's analysis still valid for today:
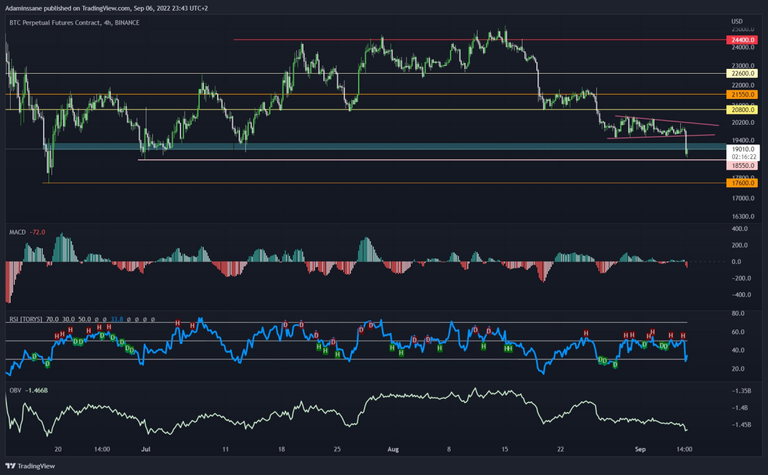
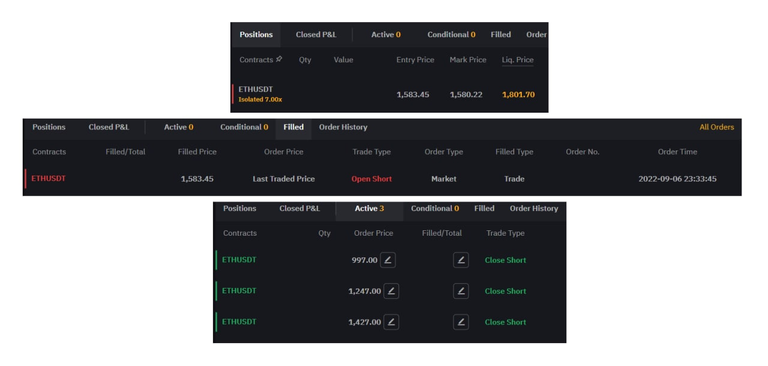
I opened a new short yesterday on ETH since the BTC has just broken its bullish bevel from below which confirms the bearish flag, and the continuation of the down trend, to see also the S&P 500 not bullish and a Dollar index DXY just go up. If the $18550 on BTC will not hold then the next support will be 17.6K
- BTC in H4: https://www.tradingview.com/x/YqGEUkBA/
- Short position on ETH:
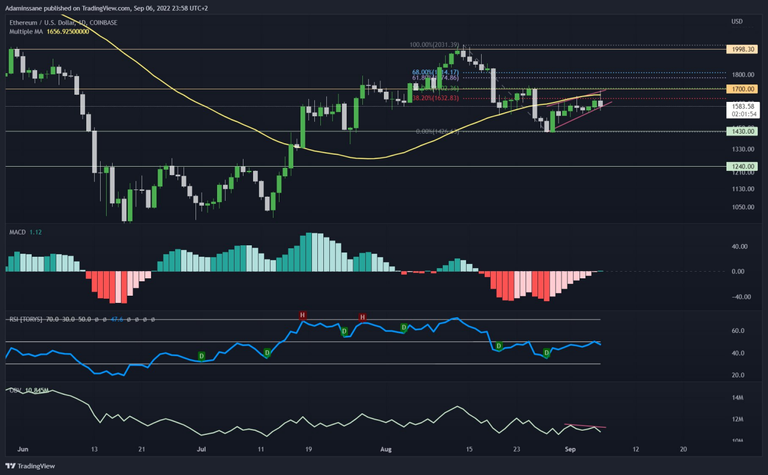
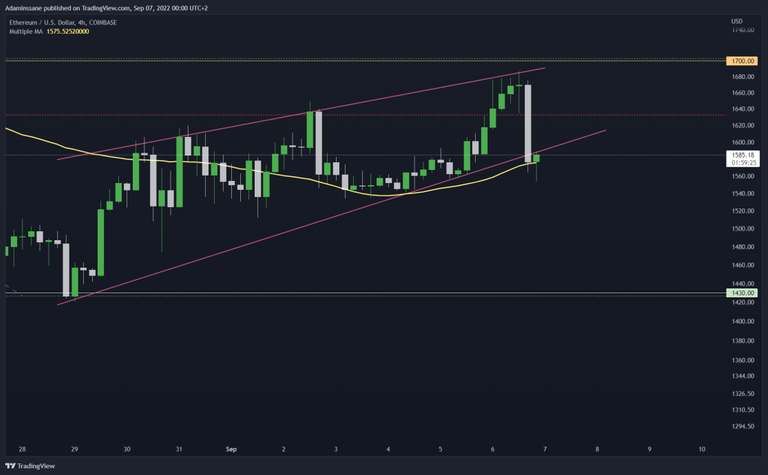
ETH is trying to hold on by staying as bullish as possible, but the S&P 500 and BTC have headed south, so I don't see how you can have ETH pushing higher on its own.
High confluence on ETH towards a reversal in Daily:
- Significant bearish divergence with the OBV which shows us that the price is rising while the volume is falling!
- The rejection of the recently tested key resistance level at $1700.
- The 50% fibo.
- The 50 moving average (in yellow) as resistance.
- Today's bearish candle with the long wick.
- The rejection of the 50 level of the RSI
- The break of the bullish channel from below (visible at H4) and now the price is doing a pull back.
- ETH in Daily: https://www.tradingview.com/x/2gTzK8xM/
- ETH in H4: https://www.tradingview.com/x/FJT4YUlx/
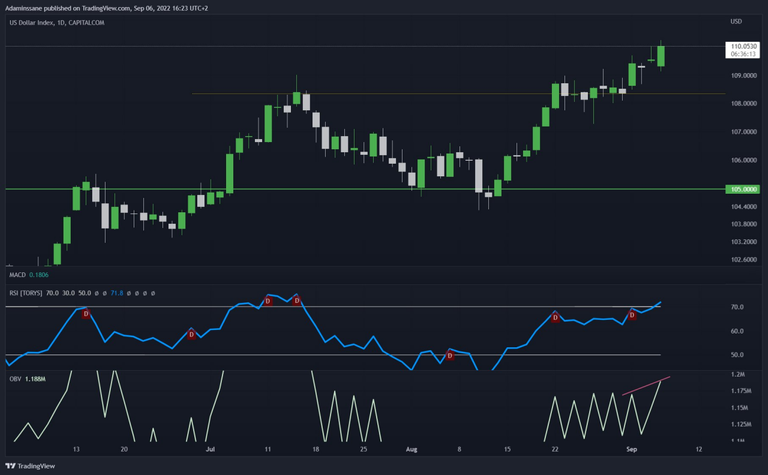
The Dollar is going above 110 since the opening of the S&P 500 yesterday at 3:30 p.m. which continues to fall.
The bearish divergence on the DXY is canceled for now as the price rises along with the OBV and RSI.
https://www.tradingview.com/x/TwqdfmNB/
👉 Please follow the links below to the top 5 of the best & Secured Exchanges for trading on Spot or Futures & often gives rewards for using their platform like Learn & Earn Program, making deposit & Trading on spot or Futures, Trading Competition,...etc.
📈 Binance: https://www.binance.com/en/register?ref=12258276
📈 FTX: https://ftx.com/#a=1768923
📈 Bybit: https://www.bybit.com/register?affiliate_id=13236
📈 Phemex: https://phemex.com/register?group=718&referralCode=BAR9K
📈 Bitmex: https://www.bitmex.com/app/register/xXePh3
👥To support my work, don't hesitate to follow me on Publish0x to help a larger community, my goal is to learn with sharing & trying to remain as transparent as possible and if it can help other people I would be very happy to prevent some small fish like me to avoid losing money or all capital.