The "Estimated Account Value" that you see displayed in your wallet is calculated as the 7 day average value of STEEM, which has been going down the past few days.
However, on the internal market, the value of SBD (since they've been "printing" more of them, has been going down versus STEEM). On the internal market, it looks like from one of your trades, you sold 61.878 SBD to receive 34 STEEM, which is equivalent to a rate of 1.81 SBD / STEEM.
Now, I don't think this is even reflected for you yet, but the price of STEEM also just tanked 20% on the internal market versus where you traded your SBD as well, which can be attributed to a bit of bad timing. That's also why if you are looking to convert and can afford to wait, it's usually worth holding out for "tanks" such as these to take place before making your exchange. Of course, one never knows for sure, and it can keep going up. But usually you'll get at least a short "panic" opportunity at some point to catch a better price...
Thanks very much for your insight. SBD had been steadily decreasing in value, and I expected that sooner was better than later to make the transaction. Clearly I was shooting at a target I could not see.
Where do you get that chart? Also, it is rather busy. None of the plots are labeled, so it is as opaque as my last (and first) trade was to my understanding.
I expect you are correct about the price of Steem impacting my account value. The loss seemed to be entirely caused by my trade, and I do expect further account value decrease as a result of Steem losing value.
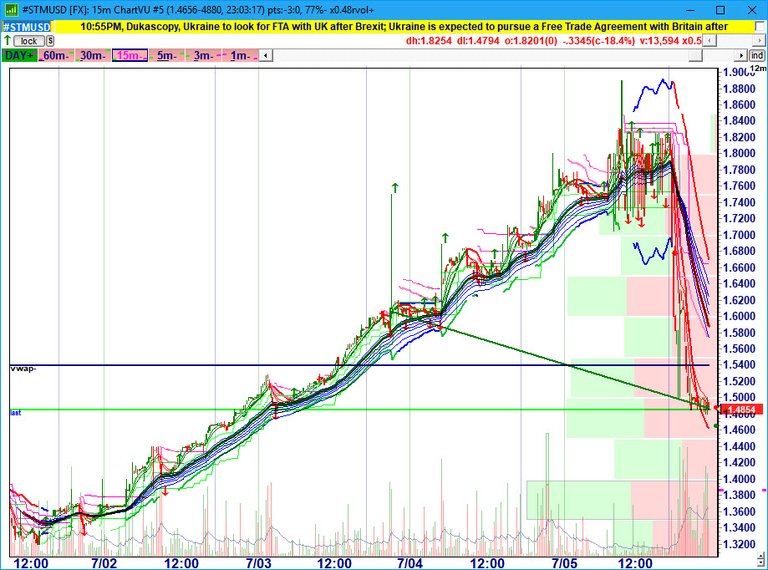
The chart is from my trading platform tymoraPRO. All the indicators I use (besides following the raw price action) tend to be related to identifying a volatility distribution on the move, and also help identify when prices reach extremes on a various time frames.
This chart has lower band GMMAs, 5/8/34 ohlc XMAs, VolSqueeze (combination of acceleration bands and bollinger bands), VWAP, Volume/VolMA (volume moving average), VolTrails (volatility trails that track a sort of "pain point" for traders, sort of like a multi-timeframe version of Chandelier Stops), and VolByPrice (volume by price on the right). I could write several posts just on each of those!
But that should be enough for now if you want to google around a bit. Also, once you've studied trading long enough, you start to quickly get an idea all the indicators being used. Having each one listed on a chart often just takes up extra space. Here's one though with a bit less going on!
Wow! when you said 'your' trading platform I did not realize you meant one you had created.
Even though I need to put down my voting, I voted you up, just cuzza dat. Very awesome platform.
I do understand that YOU understand the chart without needing to label the various plots.
I don't. However, this, and the one you posted before, just at a glance, seem to show that price plunged just prior to my transaction. Had I known this, I, even I, would probably have been able to hold off on the transaction.
That alone would have saved my account at least $40.
Thanks! I very much appreciate your consideration.
Yeah, there was quite a bit on there, so I know where you're coming from. Bigger point I was getting at was really just to show you the price action.
Glad you found my responses at least somewhat helpful, and thanks for the upvote! :)
btw, on the 5m chart I posted, notice how as price rose back above those "levels", what's happened since then... back to nearly $1.50 again!
yes. LOL this was my point about my personal luck when it comes to timing, which in investing is practically everything.
While knowledge and skill can overcome luck, as I also indicated, without access to the kind of platform you have created, I am dependent on my luck.
I'm better off staying out.
Thanks again for your extensive and informative consideration!
BTW, another reason it looks more cluttered is because I was showing a lot of data. Here's a 5m chart with a bit more zoom on it. Also notice the dramatic increase in volatility that began expressing itself as the previous upmove came to an end (lots of wide spreads, low directional liquidity, etc)...
There is indeed a lot of data, all of which is unlabeled. Since I don't know which particular plot represents which particular dataset, it is difficult to know which plot represents volatility, for example.
From your statement that volatility increased as the move upwards was ending, I am guessing the the disconnected blue lines above and below the main body of plots represent volatility?
What is the m in '5m'? It seems not to be months, or minutes..
Anyway, I strongly agree that with your platform I would be far less likely to throw away my hard earned SBD on foolish trades. Since I do not possess your superb tool to analyze investments, I am probably better off not making trades.
Interesting note: The day I first invested in equities, was the day the dot.com bubble burst. I lost almost 1/3 of the value of my investment that day, as I had told my broker to put it all in the raging tech equities that had been performing so well.
Over the next two weeks, my broker (morgan stanley) continually assured me that all was well. Finally, exasperated, I told them to sell everything NOW, and put it all in MEOH, which had just plunged to $2.50 from over $25.00 on news that California was angry at them.
It was a ten bagger, and by the end of the year, my account was up $80. I consider that both a warning, and a success story. It is a warning, because it tells my my timing is not just unlucky, but maximally unlucky - as my recent sale of SBD confirms. =p
Sorry to hear about your Internet bubble story, but truth be told we all get into those phases. That's why risk management and position size is so critical when trading and investing. But it does sound like you were on the right track with MEOH, so that's something to think about... :)
Regarding the chart, 5m = 5 minute chart, though it only prints if activity actually took place during that 5 minute period (or 1 minute period for a 1m chart, etc). Regarding increase in volatility, I wasn't talking about indicators, simply the underlying price action as shown here:
What you see there are people buying high offers and low bids with not much going off inbetween, until "out of the blue" it tanked. Think of it as a bit of "hot potato". Finally people just gave up, or placed stops just below that range, and when it broke, everyone piles in all at once and chases it all the way down.
Thanks for your helpful explanation. I am surprised at the spreads between the highs and lows. I didn't realize there was a $.10 range in price, otherwise I might have tried to lowball when I bought Steem. Or highball when I sold SBD...