Moving Average
Moving average is a term for analyzing the overall price movement of a particular stock/bond/currency/CryptoCurrency. Moving average or MA is used for canceling out the noise in the price as well as determining the momentum of the market.
Depending on the Calculations, there are 3 Major types of Moving Averages:
- SMA (Simple Moving Average)
- WMA (Weighted Moving Average)
- EMA (Exponential Moving Average)
Here is how they are calculated:
Let's say we want to calculate all 3 MA for a period of 5 days of the closing price of a stock.
The Stock Closing price of last 5 days in a week are : 5$, 4$, 3$, 6$ and 7$ respectively.
SMA: closing price of the periods/ number of periods. For above case SMA = (5+4+3+6+7)/5 = 5
WMA: (closing price of periods * weights of each period )/ total weight . The weight is more for latest price. For the current example: WMA = (51 + 42 + 33 +64 + 7*5) / (1+2+3+4+5)=5.4
EMA: (today's Close * K) + EMA(Previous Day)(1-K) ; where K=2/(intervals+1)
For this example:
K_fri = 2/6=1/3
EMA_fri = (71/3) + EMA_th * 2/3
K_th = 2/5
EMA_th = (62/5) + EMA_wed * 3/5
K_wed = 2/4 =1/2
EMA_wed = (31/2) + EMA_tue * 1/2
K_tue = 2/3
EMA_tue = (4*2/3) + EMA_mon * 1/3
K_mon = 2/2 =1
EMA_mon = 5 * 1
So, this Makes:
EMA_mon= 5
EMA_tue = 4.33
EMA_wed= 3.665
EMA_th= 4.599
EMA_fri = 5.399
So, EMA = 5.399
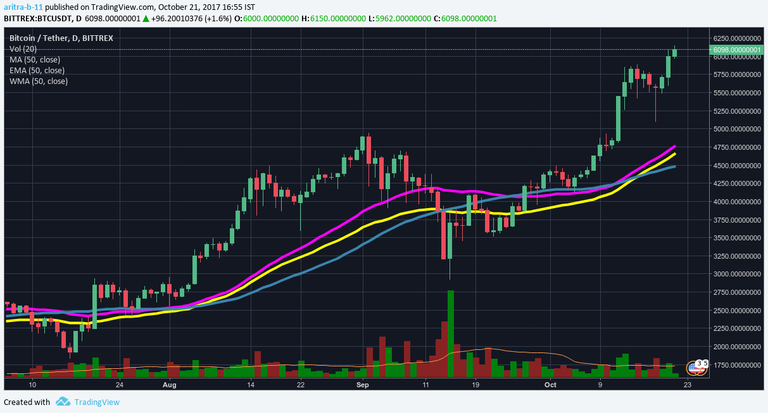
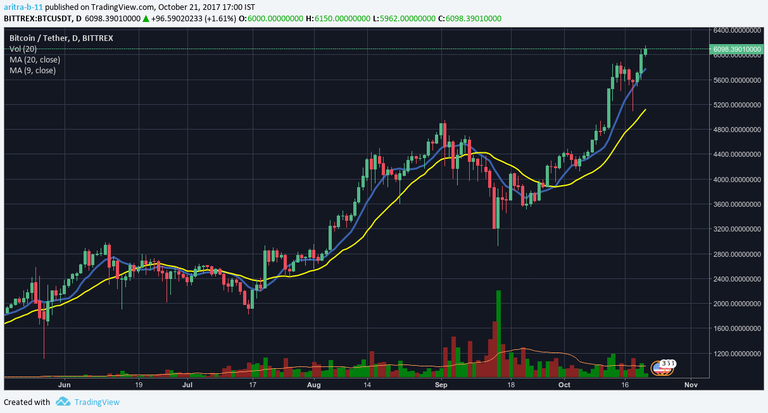
If we observe, the SMA will give us generic idea of the market movement. WMA and EMA will give more tighter correlation of momentum and price action. See the picture of BTC/USDT chart for better understanding.

SMA charting are great ways to confirm the market momentum. For example, if we see the SMA for 9 days and 20 days, we can confirm short term and mid term market directions. Notice that when we have a 9 day SMA crossing 20 days SMA from above to below, it really confirms the pullback. Similarly, if 9 days SMA is crossing 20 days SMA from below to above, it confirms the uptrend.

For long term bull and bear run, look for 50 days and 200 days SMA. This number may vary depending on the market volatility. For example, for a highly volatile market like Crypto Currency, it makes more sense to use SMA for 9 days, 20 days and 50 days for short, mid and long term effects; but for a slow moving market like fiat currency SMA 20 days, 50 days and 200 days are more applicable.
Moving average is a simple yet powerful tool for doing technical analysis. It is the base for 2 other important tools : MACD and Bollinger Band.
See you favorite chart's MA and try to find out the market momentum from it.