Hello,
It is never too late to revisit the basics.
ELI5
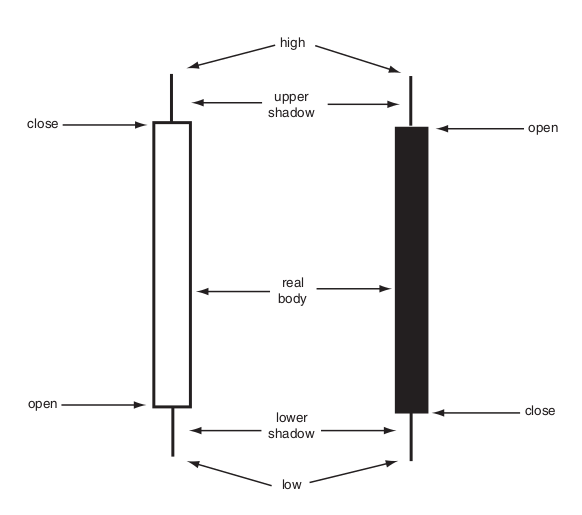
Candlestick chart pattern is most widely used charting technique. It gives the trader information about:
- open
- close
- high
- low
- overall movement about the specified period.
Take a look into the image.

The gap between open and close is the main body. High and low points are the max and min price movement over the period. If open is at a higher price than close, it is bearish candle. Similarly, if close is higher than open it is a bullish candle.
We may see different types of candlesticks:
- long body : meaning price is moving heavily. If these continues, this means, market volatility is high.
- short/no body: very little price movement. If it has long shadow, it is called Doji.
- long shadow: Price has moved heavily but eventually it did not stay in that price due to market sentiment.
Please take a look into the candlestick pattern of any CryptoCurrency / Stock / Bond / Fiat Currency.
My top 5 Candlestick pattern
Candlestick patterns that can confirm an ongoing trend or trend reversal. All though the patterns can be observed for any period of time, it is best to use 1D interval to predict/confirm the trend. Here are top 5 of my personal favorite candlestick patterns, that I use in my trading.
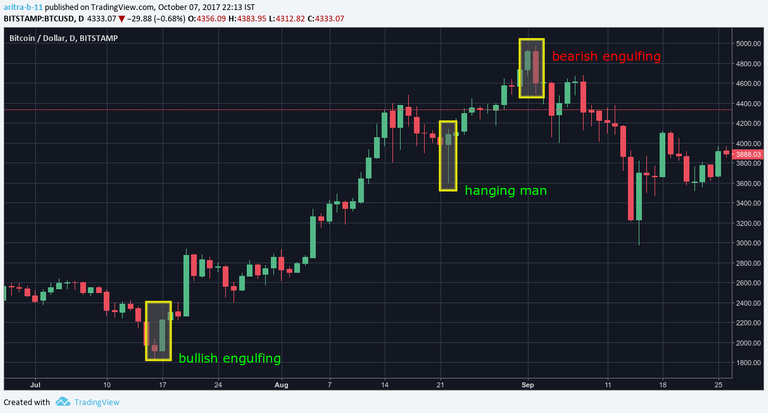
Bullish Engulfing : preceding green candle engulfs previous black candle. This means, buyers are willing to buy past the selling price. This indicates that the bull run will start.
Bearish Engulfing : preceding black candle engulfs previous green candle. This means, sellers are willing to sell past the buying price. This indicates that the bear run will start.
hammer/hanging man : green/black body with shadow 3x of body. Its color does not matter. What matters is its placement. Placed at bottom/top determines the trend reversal. It means no matter, what the trend was, the overall price point did not stay at that. So the trend might reverse now.
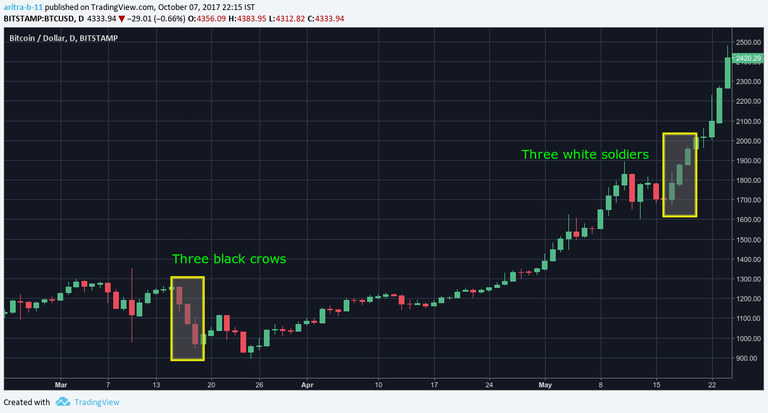
three black crows: 3 consecutive black candle stick. In a downtrend, it means the trend is likely to continue more. For an uptrend, it predicts, next could be a pullback.
three white soldiers: 3 consecutive green candle stick. In an uptrend, it means the trend is likely to continue more. For a downtrend, it predicts, next could be a pullback.


See the examples of BTC/USD chart. Please find the above 5 candlestick patterns and do calculated trade based on it. Know that all these candlesticks are based on probability but for the most part, it holds true.
If you want to read more about different types of Candlesticks, you can read: "Bloomberg Visual Guide to Candlestick Charting" by Michael C. Thomsett
Congratulations @aritra! You have completed some achievement on Steemit and have been rewarded with new badge(s) :
Click on any badge to view your own Board of Honor on SteemitBoard.
For more information about SteemitBoard, click here
If you no longer want to receive notifications, reply to this comment with the word
STOPCandlestick pattens can work for any given time frame but best results are observed for 1D period. For example, say you feel, certain stock price might go up over a few weeks. It is best to observe the daily pattern of candlesticks. The momentum can be confirmed if any bullish pattern was observed lately (e.g. bullish engulfing).
But personally, I do not find it much help for hourly charts. Since the price does not move that much over an hour, it is difficult to predict the price/trend using only candlestick patterns.
Hope this answers your question.