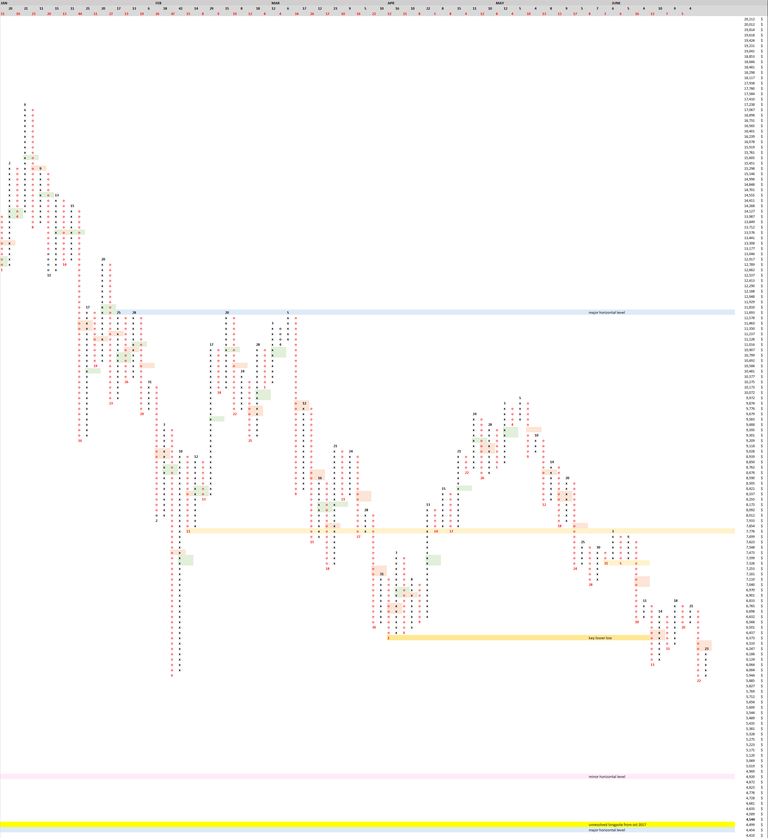
Point and Figure Chart  Yesterday we confirmed a column of 14 O's. Just now we confirmed a column of 6 X's, retracing yesterday's long pole. A pullback to $4,499 would complete unresolved long pole dating back over 8 months ago and is our next likely long-term target. Short term, we have a recent unresolved long pole of 16 O's from 6/10, a move above 7,040 would resolve 50% of the pole.
Bullish divergence on the daily RSI just confirmed: https://www.tradingview.com/x/qGRwPogU/
Here is a cheat sheet on divergence: 
Here is a historical look at daily divergence since we reached ATH 6 months ago: https://www.tradingview.com/x/Fn0XJCzI/ As you can see, they all played out at least for the short term giving bulls some relief.
Here is a look at Major trendlines since bull market ended. https://www.tradingview.com/x/6WHAOj2I/ Right now we are in the green channel down. Relief if we break out up or max pain if we break down. Part of me wishes we could break down because we would probably get a good strong bounce off the 4k range. But following today's bull div we will probably edge up out of the channel and resolve our most recent long pole by reaching 7,040.